
Its so exciting at the moment with all the changes going on in the world of Microsoft and I wanted to use the trial version of Fabric to see if I could move my ‘standard’ working practices over into Fabric.
The first thing was to find a practice dataset for this exercise so of course I went for my favorite stats based show. UK Taskmaster.
Kaggle
Kaggle delivered the goods with csv files of taskmaster information
https://www.kaggle.com/datasets/sujaykapadnis/comedians-challenged-ridiculous-taskmaster-ds
The challenge is to deliver a star schema from this data. Transforming it and creating Dims and Facts for the ultimate goal of a star schema.
CSV – SQL DB – Power BI
Usually I use Data factory to pull the data into a SQL database. In here I create Stored procedures to transform the data. These stored procedures are then added into the pipeline so we can rerun when needed.
Finally, the dimensions and facts are imported into Power BI from the Dims and Facts in the SQL Database.
So the question is. can I transform my files using Pyspark within a Notebook, and then create the Dim and Fact tables in DELTA PARQUET
I have used SQL for over 20 years and its my weapon of choice so this is going to be a real puzzler of a task.
Getting Started – Create the Fabric Workspace
I have my Fabric Trial and a Workspace added to the Fabric Trial.

Azure Devops
I always set up an Azure Devops


Here I have just Added a new Project. to Devlops Debbies Training
Visual Studio
I am going to use Visual Studio for the next task, but there are lots of other ways you can do this next step


And connect to the repository that has been created (You need to log in to see your repos)
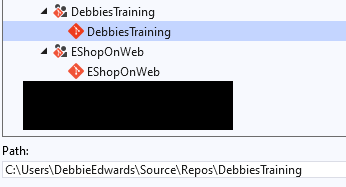
Click clone and you will then have a local copy of the code base. it doesn’t support everything at the moment but it does support Notebooks, which is what will be used for this exercise.
C:\Users\DebbieEdwards\source\repos\DebbiesTraining
Connect Devops to Fabric
Back in Fabric


We will go back to the repos Soon to start using it.
Create a Delta lake in your Fabric Workspace in Data Engineering Fabric Experience

Clicking on data Engineering takes you to the Data engineering area of fabric where you can set up a Lakehouse.

I have simply called the Lakehouse DebbiesFabricLakehouse
When the Data Lakehouse is completed you get the following

And for the time being, Lets just use Lakehouse.
Add CSV Files into the Lakehouse
Notice that we have the following folders in the Lakehouse

For this project, the medallion architecture is being used.
- Bronze is where the csv files are stored in the lakehouse. the raw data zone
- Silver is the transformed PARQUET data will go (Which we will look at later)
- Gold is the final transformed STAR SCHEMA layer. The curated zone.
I have all the taskmaster csv files and I am going to simply upload them to the Lakehouse Files / Data / Bronze folder

Refresh the folder and you should see your files in the pane.
Create the Notebook
Now we can start to work with the files and here is where the fun starts. Instead of a pipeline that pulls data into SQL before the transformations, Lets create a Notebook


We are ready to go. this is what I can see to the right of the code pane.

And Pyspark will be the Spark language of choice. I wont use any SQL just to see how it goes, away from my beloved SQL.

I am doing very simple code at the moment and hope make it better and better the further I get so lets just start adding Pyspark and markdown (Descriptions)
This is the first lab I used to get going
https://microsoftlearning.github.io/mslearn-fabric/Instructions/Labs/02-analyze-spark.html
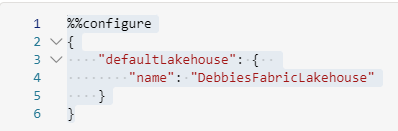
when you first run the notebook you have to start a spark session against the delta lake. To do this I have started with the following code
%%configure
{
    "defaultLakehouse": {
        "name": "DebbiesFabricLakehouse"
    }
}
Read the CSV File into a DataFrame
#Read the first file into a DataFrame
dfattempts = spark.read.format("csv").option("header","true").load("Files/Data/Bronze/attempts.csv")
# dfattempts now is a Spark DataFrame containing CSV data from "Files/Data/Bronze/attempts.csv".
display(dfattempts)
Now we read our first csv into a data frame. A DataFrame is basically a table of data.

We can click on the play icon to run this part of the code. We can now start transforming.
Contestant transformation
The first thing I want to do it get out contestants. Create a unique key and add the key to the Dim table and the transformation table which still contains all the facts.
(I have gone back and forth in the code as I have worked on it so some code has been amended when certain issues have come to light)
#We will use this later in the process. the Following code renames the columns from the original data frame but brings back the entire dataframe again
#We actually only need the contestant part

dfattempttrns = dfattempts.withColumnRenamed("contestant","contestantIDToRemove").withColumnRenamed("contestant_label","contestantToRemove")
dfattempttrns.printSchema()


print(dfattempttrns.count())
print(dfattempttrns.distinct().count())
display(dfattempttrns.distinct())
A Transformed DataFrame is created from the main DataFrame and initially, two items have been renamed. contestant to contestantIDToRemove and contestant_label to contestantToremove. We will see why later.
We also print the count of contestants and we display the transformed data frame.
Create Contestants Dim
The line from pyspark.sql.functions import col imports the col function from the pyspark.sql.functions module
Here is an explanation of what it does.
Pyspark is a Python library used for working with big data and performing distributed data processing using Apache Spark.
The pyspark.sql.functions module provides a set of built in functions that can be used for data manipulation and transformation in Spark DataFrames.
The col function is one of these built in functions. It is used to:
- Reference a column in a DataFrame.
- You can use it to: Select a specific column.
- Apply mathematical operations to a specific column. Create new columns based on existing ones
#import the function col to use.
from pyspark.sql.functions import col

#Creates the full distinct list.
dfcont = dfattempts.select(col("contestant").alias("contestantID"), col("contestant_label").alias("contestant")).distinct()

display(dfcont)
This code gives us a distinct list of Contestant IDs and Names and we have aliased the new names in this DataFrame. this uses our original first DataFrame, not the transformed one.
Again, we display the table

Order
#dfcont.orderBy([‘contestantid’], ascending = [True]).show(1000)
dfcont = dfcont.orderBy([‘contestantid’], ascending = [True])
dfcont.show(1000)
This code block just orders the data. The interesting part of the code here is that instead of display we use show to print out the DataFrame. If you leave it as show() only 20 rows are printed.

If you leave the code at show() only 20 rows are returned
Create a DataFrame of values
This is for information only. I wanted to see how a DataFrame is created of information specified in the code block.
from pyspark.sql import SparkSession
In PySpark, the SparkSession class serves as the entry point for programming with the Dataset and DataFrame API. It allows you to create DataFrames, register them as tables, execute SQL queries, cache tables, and read Parquet files.
From pyspark.sql import Row
In PySpark, the Row class is used to represent a row of data in a DataFrame. Each field in a Row object can be accessed by its name or index.
#https://saturncloud.io/blog/adding-new-rows-to-pyspark-dataframe-a-comprehensive-guide/
#Just for information. Not being used but here is how you write your own dataframe
from pyspark.sql import SparkSession
from pyspark.sql import Row

#I dont think I need this because I already have a spark session?
#spark = SparkSession.builder.appName('AddRows').getOrCreate()

data = [(70, 'Sam Campbell'),
         (71,'Julian Clary'),
         (72,'Lucy Beaumont'),
         (73,'Sue Perkins'),
         (73,'Susan Wokoma')]
columns = ["contestantID", "contestant"]
dfnarowCont = spark.createDataFrame(data, columns)

dfnarowCont.show()
Create a New Row for the default NC Row
for a dimension we always have a default row of Not Known and a key of -1. For example if we are looking at Customer orders and a customer hasn’t bought anything this month
| DateKey | Customer Key | Quantity |
| 01012022 | 56 | 244 |
| 01012022 | -1 | 0 |
Here we have -1 in the fact dimension so we can then bring through all the default Not known descriptors from the customer table if we need to, when analysing in Power BI.
from pyspark.sql import SparkSession
from pyspark.sql import Row

# Create a sample DataFrame
data = [(-1, "Not Known")]
columns = ["contestantID", "contestant"]
new_row  = spark.createDataFrame(data, columns)

# Union the new row with the existing DataFrame
dfcont = dfcont.union(new_row)

# Show the updated DataFrame
#dfcont.show(1000)

dfcont.show(1000)

Now, lets run a distinct, in case we have run the above code numerous times and we have multiple default rows.
#Just in case. We distinct again to remove any extra NA Rows
dfcont = dfcont.distinct()
dfcont.show(1000)

Testing the DataFrame for Unique values
https://www.statology.org/pyspark-count-by-group/
Our Dimension should consist of unique values. So we need to test our new dataset
from pyspark.sql.functions import *

dfcont.groupBy('contestant')\
       .agg(min('ContestantID').alias('MinContestantID'),count('contestant').alias('TotalRecords'))\
       .filter(col('TotalRecords')>1).show(1000)
Notice we don’t have dfcont = Because this loads the results into a data frame. here we are just looking at the data frame. It is basically just a SELECT statement
agg is used to calculate more than one aggregate (multiple aggregates) at a time on grouped DataFrame.
So to perform the agg, first, you need to perform the groupBy() on DataFrame which groups the records based on single or multiple column values, and then do the agg() to get the aggregate for each group.
The only thing that makes these values none distinct is that they will have different ContestantIDs. So this query is bringing back the min(ContestantID)
Here we can see that we do have some bad data that we can transform and correct so everything in both the dim and the transformation tables holds the min ID
Create a DataFrame of all contestants with Min Contestant ID
Lets set a DataFrame and use it to update. We bring back the entire contestant list with the min IDs only. Creating a distinct list
#We need to import a function for col
from pyspark.sql.functions import *

dfminContID = dfcont.groupBy('contestant')\
                     .agg(min('ContestantID').alias('MinContestantID'),count('contestant').alias('TotalRecords'))

dfminContID.show(1000)
GROUPBY and AGG and FILTER
- Group on Contestants
- Aggregate gives us a count of contestants called TotalRecords
- Then we filter to only find records where TotalRecords is greater than 1
Lets check the new distinct list with Min IDs we have made
#We need to import a function for col
from pyspark.sql.functions import *

dfminContID.groupBy('contestant')\
        .agg(count('contestant').alias('TotalRecords'))\
        .filter(col('TotalRecords')>1).show(1000)
JOIN two DataFrames Where JOIN Columns are the same
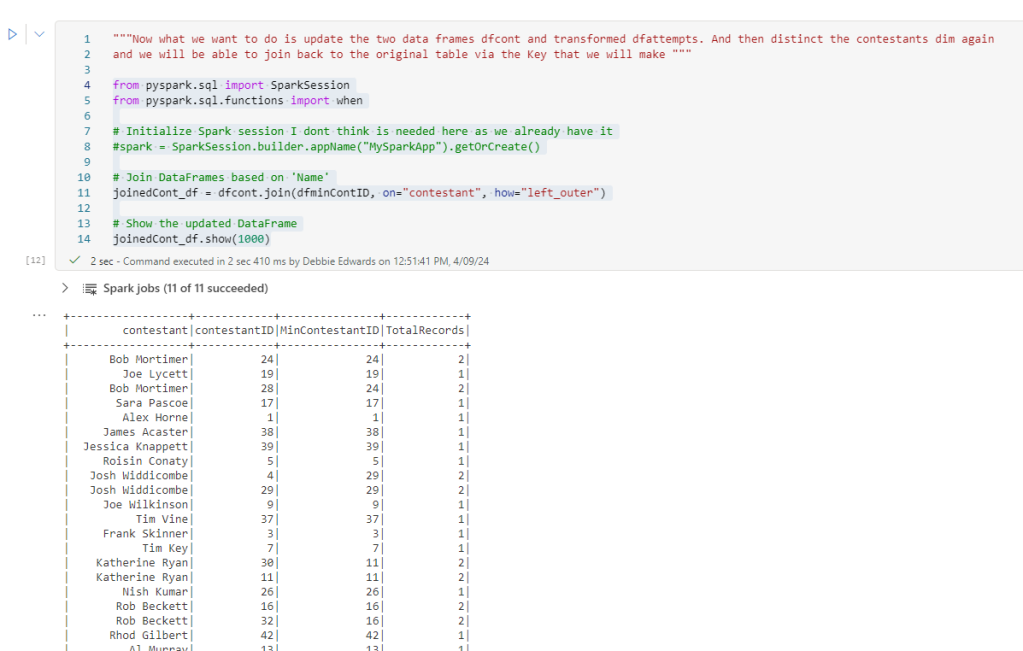
Now what we want to do is update the two DataFrames dfcont with Min ID’s.
from pyspark.sql import SparkSession
from pyspark.sql.functions import when
# Initialize Spark session I dont think is needed here as we already have it
#spark = SparkSession.builder.appName(“MySparkApp”).getOrCreate()
# Join DataFrames based on ‘Name’
joinedCont_df = dfcont.join(dfminContID, on=”contestant”, how=”left_outer”)
# Show the updated DataFrame
joinedCont_df.show(1000)
for the next step lts reupdate dfCont with our updated min value
#We want to reset back to ContestantID and Contestant, this is a distinct List

dfcont = joinedCont_df.select(col("minContestantID").alias("contestantID"), col("contestant")).distinct()
dfcont.show(1000)

We updated ContestantID with MinContestantID
So, we have reset the ContestantID with the correct min ID
You can’t modify the existing dataframe as it is immutable, but you can return a new dataframe with the desired modifications.
Recheck a specific contestants data – Filter
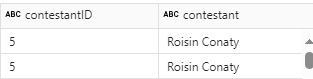
Lets do a filter on a contestant we know had a duplicate ID
dfcont.select(col("contestantID"), col("contestant")).filter(dfcont.contestant == "Noel Fielding").distinct().show(1000)
Update the ID of the transformed Table
We also want to update the Contestant ID of our transformed table (dfattempttrns) we created near the beginning of the notebook. Eventually we can create a fact table from dfattempttrns with Contestant Keys, so we want to join them via the ContestantID.
this is where the data items contestantIDTORemove and contestantToremove comes in handy
#we also want to update the ID of our transformed table we created near the beginning of the notebook

dfattempttrns = dfattempttrns.join(dfcont, dfattempttrns["contestantToRemove"] == dfcont["contestant"], how="inner")

dfattempttrns = dfattempttrns.join(dfcont, on="contestant", how="inner")"""

display(dfattempttrns)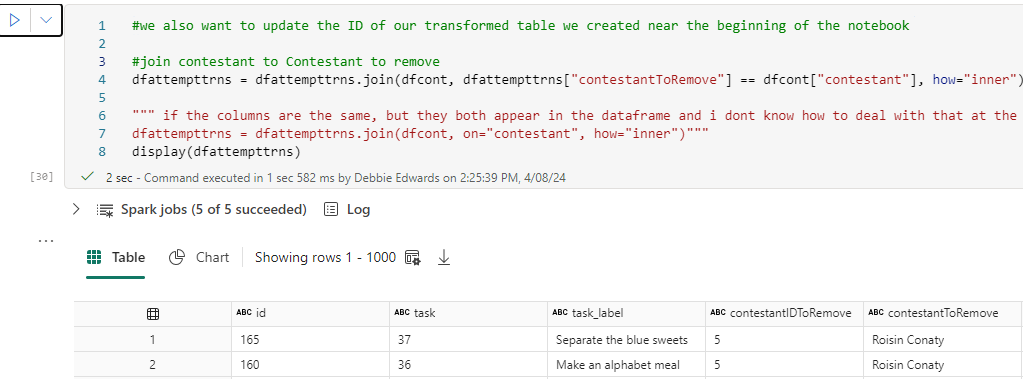
There are two extra columns at the end from our corrected dfcont DataFrame.
the join was on the contestantname
#Lets have a look at the schema
dfattempttrns.printSchema()
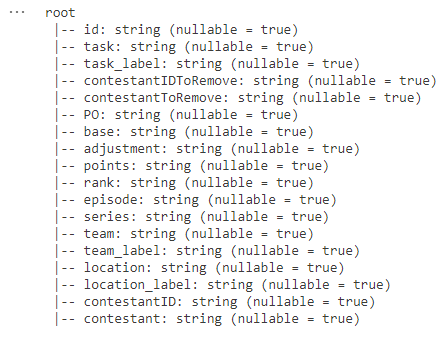
Here we have a little code to display the Schema of the updated dfattemptstrans DataFrame
Drop Columns
# Drop columns
cols_to_drop = ["contestantIDToRemove", "contestantToRemove"]
dfattempttrns = dfattempttrns.drop(*cols_to_drop)
dfattempttrns.show()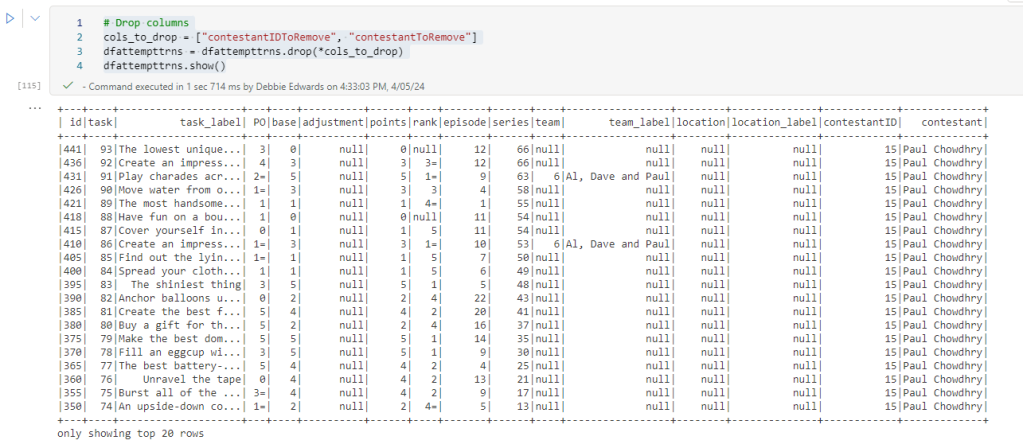
And just to be sure we can now check for our Contestant again
#Lets do a filter on a contestent we know had a duplicate ID
#dfattempttrns.filter(dfattempttrns.contestant == "Noel Fielding").show(1000)
from pyspark.sql import SparkSession
from pyspark.sql.functions import col
dfattempttrns.select(col("contestantID"), col("contestant")).filter(dfattempttrns.contestant == "Noel Fielding").distinct().show(1000)

Its now working. there is only one record in both the transformation table and the dimension table so the join on ID’s will work.
Creating the Dim Key – Adding a column .WithColumn
For contestants Dim we need a Key. So we need a new column. Lets add a new column to create the partition on. I’m sure there are lots of ways to do this and later in the process I will be able to really hone the code down with more Pyspark knowledge.
from pyspark.sql.functions import lit

# add column for discount
dfcont = dfcont.withColumn("Partition", lit(1))
# display the dataframe
dfcont.show(1000)
Create the Contestant Key using Partition by
#Now finally for this we need a Key a new column
# Imports Window and row_number
from pyspark.sql import Window
from pyspark.sql.functions import row_number

# Applying partitionBy() and orderBy()
window_spec = Window.partitionBy("Partition").orderBy("ContestantID")

# Add a new column "row_number" using row_number() over the specified window
dfcont = dfcont.withColumn("ContestantKey", row_number().over(window_spec)- 2)

# Show the result
dfcont.show(1000)
Use – 2 which starts the ID no at -1 (-1,0) so the default can have the -1 key as standard
from pyspark.sql import Window
- Imports the Window class from the pyspark.sql module123.
- The Window class is used to define a window specification in the DataFrame API2. A window specification is defined by specifying partitioning expressions and ordering expressions2.
- The partitioning expressions are used to partition the data into groups, and the ordering expressions are used to order the data within each group2.
from pyspark.sql.functions import row_number
- The row_number function from the pyspark.sql.functions module is used to assign a unique row number to each row in a DataFrame.
- It is commonly used in Spark SQL to create a sequential identifier for rows based on a specified order.
because the NA ID is -1 for the default row it immediately gets the Key of -1 because of the order which is just what we wanted.
#We want to remove the partition key from the dim

dfcont = dfcont.select(col("contestantKey"), col("contestantID"), col("contestant")).distinct()
dfcont.show(1000)
Adding Team to Dim Contestant
there is another item we want to add into the contestant dim. The Team.
First of all, lets get a distinct list of everything we need from dfattempttrns. Namely. the contestantID and Contestant, TeamID and TeamName (These two are new, we haven’t worked with them so far)
#import the function col to use. But shouldnt it already be available?
#from pyspark.sql.functions import col

#Creates the full distinct list.
dfContTeam = dfattempttrns.select(col("contestantID").alias("teamcontestantID"), col("contestant").alias("teamContestant"),
col("team").alias("teamID"),col("team_label").alias("TeamName")).distinct()

display(dfContTeam)
The original DataFrame includes the tasks and team is only set on a team task. In Contestants we simply want to know which team the contestant is in.
we have created a new DataFrame called dfContteam
Remove rows with NULL team IDs
# Import necessary libraries and create a Spark session
##from pyspark.sql import SparkSession
spark = SparkSession.builder.master("local[1]").appName("SparkByExamples.com").getOrCreate()

# Drop rows with NULL values in the "id" column
dfContTeam = dfContTeam.na.drop(subset=["teamId"])

# Show the filtered DataFrame
dfContTeam.show(truncate=False)
Join tables to add team to contestants Dim using the contestant Name
#Now what we want to do is add TeamName into dfcont

#If we were joining on items with different columns names we could use the following
dfcont = dfcont.join(dfContTeam, dfcont["contestant"] == dfContTeam["teamContestant"], how="inner")

dfattempttrns = dfattempttrns.join(dfcont, on="contestant", how="inner")"""
display(dfcont)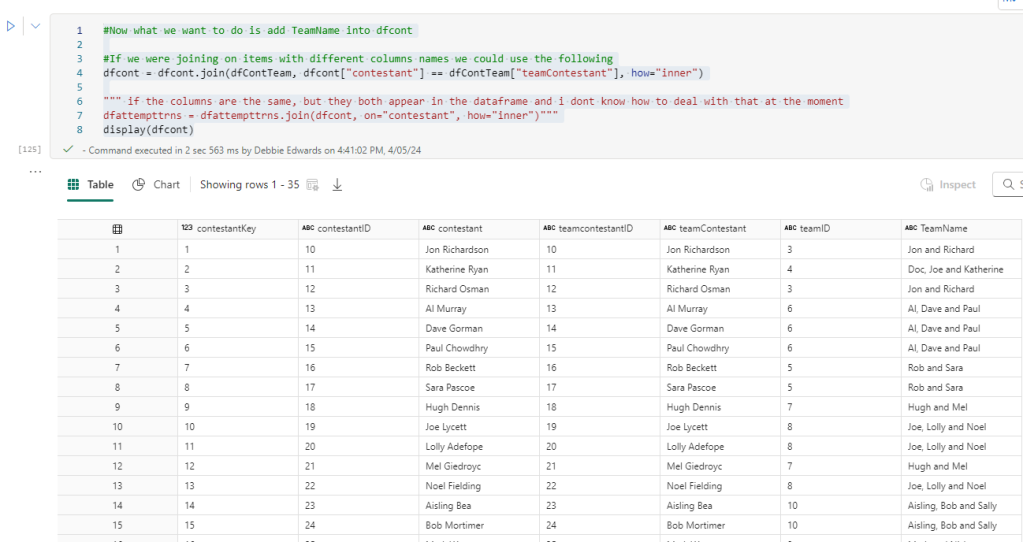
When the dfContTeam was created. Contestants was called teamContestant and this is the join you see in the code.
Drop Columns
# Again we need to Drop columns we don't need from the data frame
cols_to_drop = ["teamContestant", "teamID","teamcontestantID"]
dfcont = dfcont.drop(*cols_to_drop)
display(dfcont)
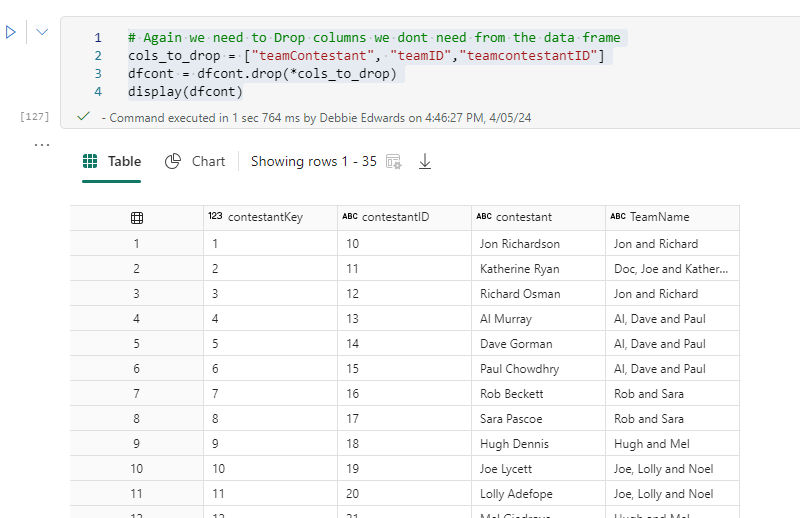
Finally. A Dim Contestant DataFrame with everything we need.
Adding ContestantID into the transformed DataFrame
Before creating a PARQUET File it would be good to get the Contestant Key into the transformed table by joining the tables again on contestantID
#join contestant to Contestant to remove
dfattempttrns = dfattempttrns.join(dfcont,
                                    dfattempttrns["contestantID"] == dfcont["contestantID"],
                                    how="inner").drop(dfcont.contestantID).drop(dfcont.contestant)


display(dfattempttrns)
We now have .drop(dfcont.contestantID).drop(dfcont.contestant) in the code which removes our duplicate columns before they are added into the transformation table
UPDATE – We have learned how to update using different column names AND Update using the same column name, whilst removing any columns from table B that are identical to table A
Creating the DELTA PARQUET FILE
Finally we can add Dim Contestants to a PARQUET file. We don’t need any partitions because its just a small dim table.
from delta.tables import DeltaTable

dfcont.write.mode("overwrite").format("delta").saveAsTable("dimContestant")
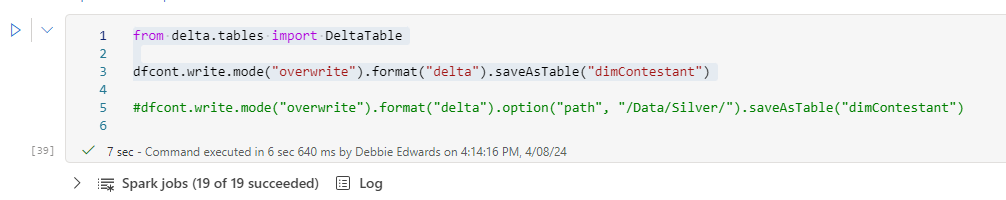
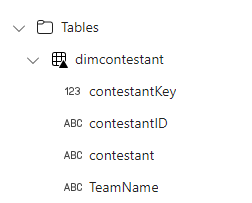
After a refresh on tables
this creates a Delta Lake table called DimContestant which is stored in Delta Format and provides ACID Transactions. for example, Time travel and versioned data.
The Black triangle icon means that it is a DELTA PARQUET file.
Save as PARQUET File
However you can also do the following
dfcont.write.mode("overwrite").parquet('Files/Data/Silver/DimContestant.parquet')
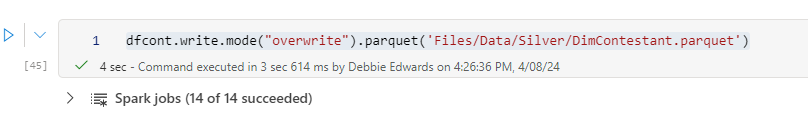

This saves the DataFrame as a Parquet file into a specific folder in Files.
Its columnar storage that works really well for analytics workloads but doesn’t support ACID DeltaLake transactional support live time travel mentioned above.
Lets have a look at what we have created (the data is none partitioned)


A PARQUET File is a columnar storage file. In the same way as Power BI has a columnar data store when you import the data.
Our data is in the snappy.parquet file.
The Success File is not a specific file format. Its the concept related to the execution so here we can see that the creation of the file was a success.
So:
- Delta Lake PARQUET with advanced features and transactional capabilities. Tables have to be in Tables folder in order to be recognized by other engines like SQL endpoint and semantic model.
- PARQUET for storage and simplicity. But are only visible for Spark?
We will look at these both in more detail in a later exercise.
Stopping the Spark Job
Its always worth stopping the Spark job at the end of processing
spark.stop()
It will stop automatically after a time but this ensures that the process is stopped immediately upon the end of the transformation process
Using Source Control

Clicking back on the workspace. We added our workspace to Devops. So now we can see that there has been a change.

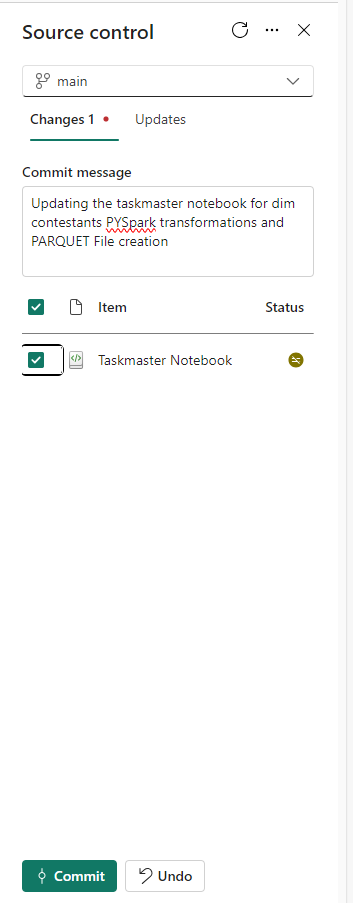
when working with other people there will be feature branches to connect to rather than main but because this is just a one person exercise. Committing to main is fine for the time being.
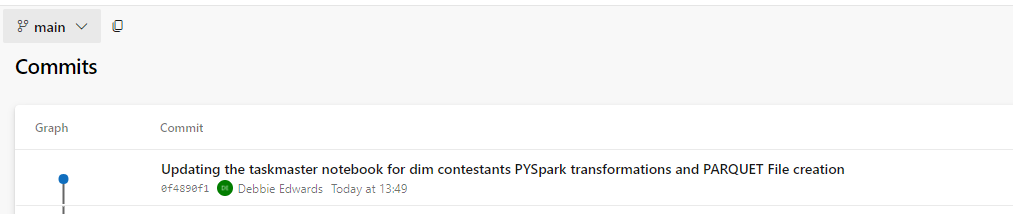
And in Devops we can see that the code has been committed.

Conclusion
We have taken an example group of csv files and transformed them so far to create one dimension for a star schema.
This dimension data will be added into a star schema via the contestant key.
We have also set up Devops to commit the notebook code into the GIT repository.
In later posts we will move on to other dimensions. Create the fact tables and see what we can do with both the DELTA PARQUET and PARQET Files.

One Reply to “”