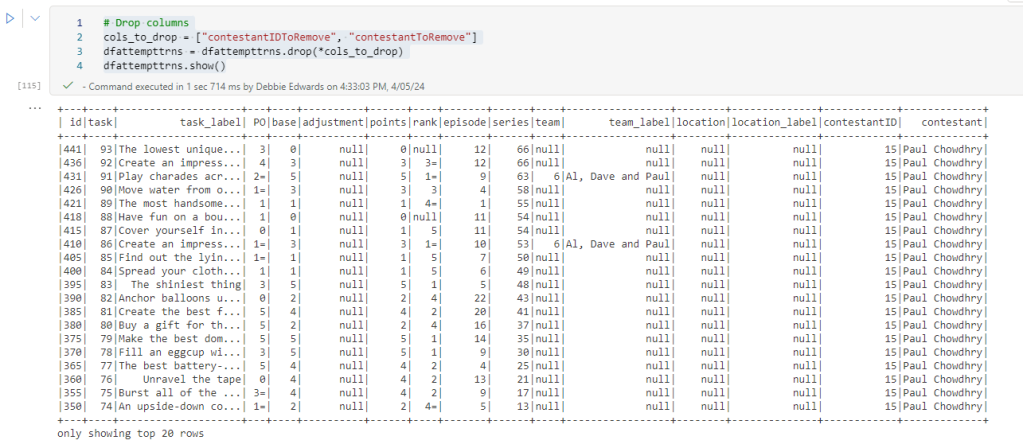
In Parts 1 and 2, we did a lot of analysis on the data. Understood Contestants and the data between the csv files attempts and people. Its now time to create some of the other dimensions we need for the project.
- DimTasks
- DimEpisodes
- DimDate
Back to our Taskmaster Notebook to see what other data is available to use. But first of all. When creating stored procedures to transform data on SQL DB, The stored procedures are usually split into Dims and Facts. Its time to split this notebook up into the corresponding dims and facts.
Dim Contestants


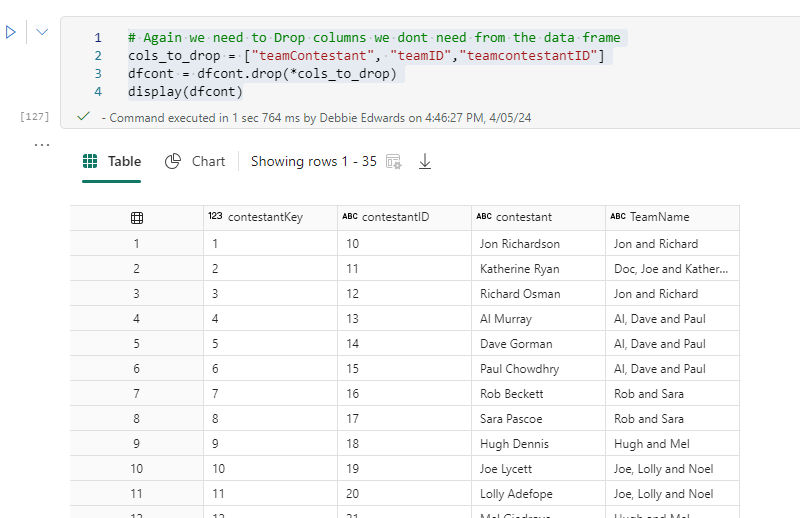
A copy of the original file is saved as DimContestants. Then the new notebook is opened and everything Customer related is saved, including the initial configuring of the Lakehouse.
The notebook ends with the creation of the overwritten files.
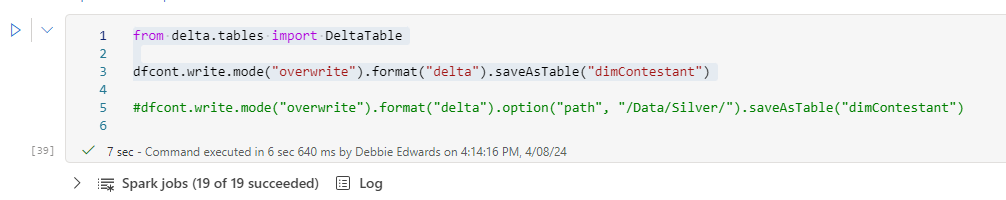
The Code
spark.stop()Is more interesting. Do we want to stop Spark after every dimension and fact creation. Or only at the end of the process?
One to think about but for this, lets have this after every notebook has run.
DimEpisode
Another copy is made to create DimEpisode. everything is removed apart from code that can relate to DimEpisode.
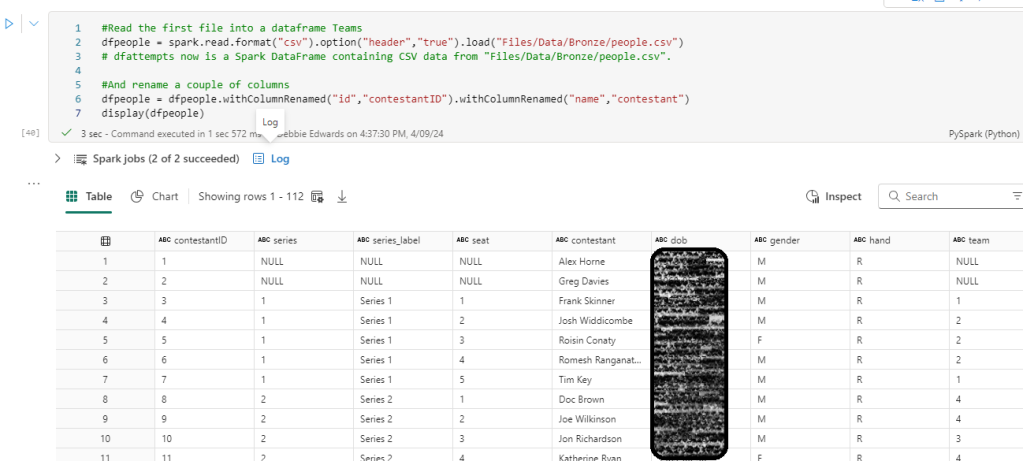
#Read the first file into a dataframe Teams
dfep = spark.read.format("csv").option("header","true").load("Files/Data/Bronze/episodes (1).csv")
# dfattempts now is a Spark DataFrame containing CSV data from "Files/Data/Bronze/episodes (1).csv".

#And rename a couple of columns
#dfpeopletransf  = dfpeople.withColumnRenamed("id","contestantID").withColumnRenamed("name","contestant")

display(dfep.distinct())
We have some key information like dates in here but we will save these as keys for the fact table when we get to the fact table.
There is also a really important fact in here. Points.
Create Series and Episodes
# Select multiple columns with aliases
dfepisode = dfep.select(
    dfep.series.alias('seriesID'),
    dfep.series_label.alias('series'),
        dfep.episode.alias('episodeID'),
    dfep.title.alias('episodeTitle')
).distinct()

# Show the resulting DataFrame
display(dfepisode)
Check that we have distinct Episodes
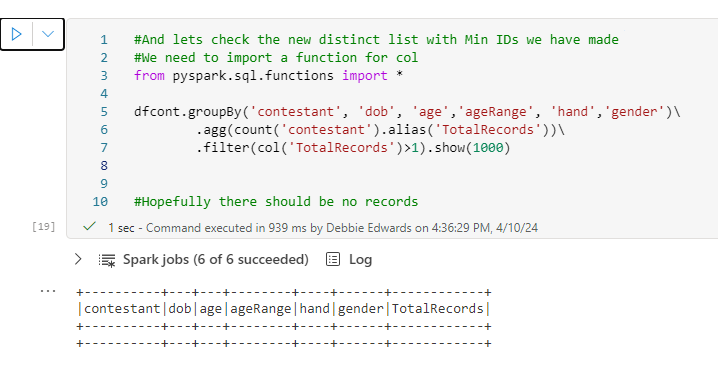
#Lets immediately do the group by and min value now we know what we are doing to create a distinct list (Removing any IDs for a different series)

#import the function col to use.
from pyspark.sql.functions import col
from pyspark.sql.functions import count as _count

#Creates the full distinct list.

dfepisode.groupBy('Series', 'episodeID', 'episodeTitle' )\
       .agg(_count('episodeTitle').alias('TotalRecords'))\
       .filter(col('TotalRecords')>1).show(1000)
This looks good. We just need to add a default row and a key and we have ourselves another dimension which will eventually contain a hierarchy between series and episode.
Add default row for series and episode
we are now doing the same code blocks we created for Contestants.
from pyspark.sql import SparkSession
from pyspark.sql import Row

# Create a sample DataFrame
data = [(-1, "Not Known","-1","Not Known")]
columns = ["seriesID", "series", "episodeID", "episodeTitle"]
new_row  = spark.createDataFrame(data, columns)

# Union the new row with the existing DataFrame
dfepisode = dfepisode.union(new_row)

# Show the updated DataFrame
dfepisode.show(1000)

#Just in case. We distinct again to remove any extra NA Rows
dfepisode = dfepisode.distinct()
dfepisode.show(1000)
Create the Episode Key
#Create an Episode Key
# Imports Window and row_number
from pyspark.sql import Window
from pyspark.sql.functions import row_number

# Applying partitionBy() and orderBy()
window_spec = Window.partitionBy().orderBy("episodeID")

# Add a new column "row_number" using row_number() over the specified window
dfepisode = dfepisode.withColumn("EpisodeKey", row_number().over(window_spec)- 2)

# Show the result
dfepisode.show(1000)
Create Delta PARQUET
What is the difference between Delta PARQUET and PARQUET
The Basic PARQUET File is the same, but we also have a _delta_log directory and checkpoint files. The Delta is simply a folder that contains these objects.
from delta.tables import DeltaTable

dfepisode.write.mode("overwrite").option("overwriteSchema", "true").format("delta").saveAsTable("dimEpisode")
We have re worked the code so we overwrite the schema also if it has changed to avoid errors
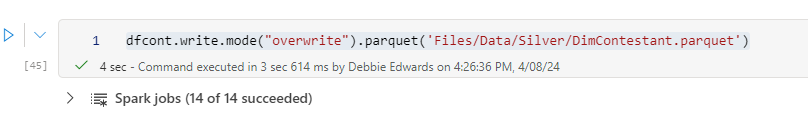
Create PARQUET
#Read the first file into a dataframe Teams
dftasks = spark.read.format("csv").option("header","true").load("Files/Data/Bronze/tasks_by_objective.csv")

display(dftasks.distinct())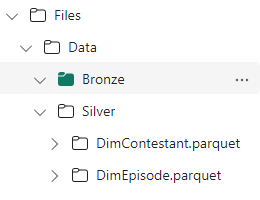
DimTask
Save a copy again and create DimTask

The Notebooks can be easily selected from the left hand pane and are automatically saved.

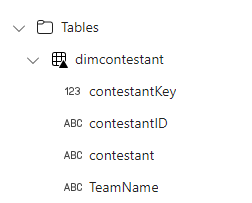
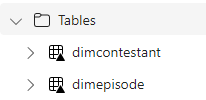
And in the workspace we can see that we have three new files to add

Our Last dimension before adding a dim date table will be tasks. After loading the tasks csv, it appears to be empty which is odd because it says there should be over 809 rows so something does appear to have gone wrong with the data source.
We need to look around the files and see what we can get.
We already know that the attempts contains tasks but doesn’t have as much data in it.
Getting Tasks from Attempts
#Read the first file into a dataframe
dfattempts = spark.read.format("csv").option("header","true").load("Files/Data/Bronze/attempts.csv")
# dfattempts now is a Spark DataFrame containing CSV data from "Files/Data/Bronze/attempts.csv".
display(dfattempts)
attempts is read into this notebook as a DataFrame again because there is a task column in this table.
# Select multiple columns with aliases
dftaskat = dfattempts.select(
    dfattempts.task.alias('taskID'),
    dfattempts.task_label.alias('task_label')
).distinct()

# Show the resulting DataFrame
display(dftaskat)
Task Objectives
dftaskob = spark.read.format("csv").option("header","true").load("Files/Data/Bronze/tasks_by_objective.csv")

display(dftaskob.distinct())
We have two task data source possibilities. Lets count the records
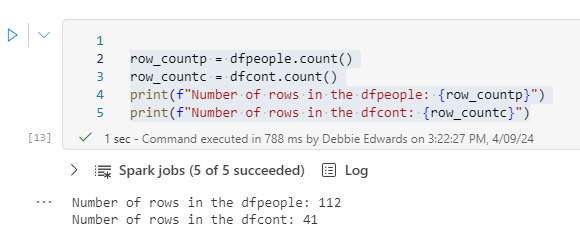
print(dftaskat.count())
print(dftaskob.count())
It would be useful to join them and then see what we have
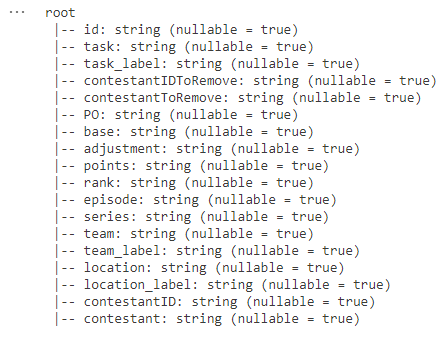
First of all, a quick glance at both schemas helps

Update dftaskob with different column names
dftaskob = dftaskob.withColumnRenamed(“task”,”taskObID”).withColumnRenamed(“task_label”,”taskOb”)
display(dftaskob)
This is because we are going to join and its easier to rename the columns that would duplicate in the joined table before we get to the actual join.

Join dftaskob and dftaskat
# condition
condition = dftaskat["taskID"] == dftaskob["taskObID"]

# Now perform the left outer join
dftaskcheck = dftaskat.join(dftaskob, on=condition, how="full").drop(dftaskob.taskObID)

display(dftaskcheck)
It seems like good sense to create the condition(s) first to simplify the code block.
A Full outer join is used and taskObID is dropped because its part of the join so we don’t really need it.

Checking Tasks in Attempts but not in Objectives
filtered_df = dftaskcheck.filter(dftaskcheck['id'].isNull())
filtered_df.show(1000)

rows = filtered_df.count()
print(f"DataFrame Rows count: {rows}")
There are 165 rows in attempt, not in task objective
filtered_df = dftaskcheck.filter(dftaskcheck['taskid'].isNull())
filtered_df.show(1000)

rows = filtered_df.count()
print(f"DataFrame Rows count: {rows}")
There are 264 tasks in Task objective that aren’t in attempts
#How many match?
filtered_df = dftaskcheck.filter((dftaskcheck['task'] == dftaskcheck['taskOb']))
filtered_df.show(1000)

rows = filtered_df.count()
print(f"DataFrame Rows count where ID and Task ID are identical: {rows}")
157 tasks are in both task objective and attempts. Lets now try to get a full list.
COALESCE and REPLACE
# We are going to COALESCE to get the item that isnt null into a null field
from pyspark.sql.functions import coalesce
from pyspark.sql import functions as F

dftaskcheck = dftaskcheck.withColumn("newTaskID",coalesce(dftaskcheck.taskID,dftaskcheck.id))
dftaskcheck = dftaskcheck.withColumn("newTask",coalesce(dftaskcheck.task,dftaskcheck.taskOb))
#dftaskcheck= dftaskcheck.select(col("newTaskID").alias("taskID"), col("newtask").alias("task"),
#col("objective").alias("objectiveID"),col("objective_label").alias("objective")).distinct()

dftask = dftaskcheck.select(
    dftaskcheck.newTaskID.alias('taskID'),
    dftaskcheck.newTask.alias('task'),
    dftaskcheck.objective_label.alias('objective'),
).distinct()


# Get Rid of ▲ and ▼
dftask = dftask.withColumn("objective", F.regexp_replace("objective", "▲", ""))
dftask = dftask.withColumn("objective", F.regexp_replace("objective", "▼", ""))

display(dftask)
So here coalesce has been used to return the DataFrame with a new column that gives us the none null item.
Then to finish ▲ and ▼ are removed.
We now just need to clean up the null objectives. Lets just assume the null objectives are points.
Remove Null values using fillna and subset
dftask = dftask.fillna("points", subset=["objective"])
dftask.show(1000)
fillna() deals with missing values. It allows you to replace or fill in null values with specified values
Create default NA Row
We have done this code multiple times now so the blog post will just show the code and not screenshots
from pyspark.sql import SparkSession
from pyspark.sql import Row

# Create a sample DataFrame
data = [(-1, "Not Known","Not Known")]
columns = ["taskID", "task", "objective"]
new_row  = spark.createDataFrame(data, columns)

# Union the new row with the existing DataFrame
dftask  = dftask.union(new_row)

# Show the updated DataFrame
dftask.show(1000)
Running a DISTINCT just in case we applied the above more than once.
#Just in case. We distinct again to remove any extra NA Rows
dftask = dftask.distinct()
dftask.show(1000)
Creating the Contestant Key
# Imports Window and row_number
from pyspark.sql import Window
from pyspark.sql.functions import row_number

# Applying partitionBy() and orderBy()
window_spec = Window.partitionBy().orderBy("taskID")

# Add a new column "row_number" using row_number() over the specified window
dftask = dftask.withColumn("taskKey", row_number().over(window_spec)- 2)

# Show the result
dftask.show(1000)
Create DELTA PARQUET TABLE
from delta.tables import DeltaTable

dftask.write.mode("overwrite").format("delta").saveAsTable("dimTask")
CREATE PARQUET Table in Files Folder
dftask.write.mode("overwrite").parquet('Files/Data/Silver/DimTask.parquet')
Remember, In the context of the Lakehouse the tables created in the Files folder are external tables.
You don’t see external table in semantic model or SQL endpoint so when we get further with this exercise it will be interesting to see what we can do with both PARQUET files.
This is the end of the Task Notebook.

Dim Date
We have dates in our data which means, for a STAR schema we need a Date dimension and yes, We can create this in a Notebook.
Create a new notebook Dim Date

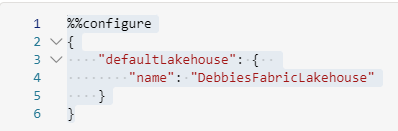
Start of again by configuring the Lakehouse and starting the spark session

There are many ways to do this. You could use SQL Magic, Or embed SQL into the Pyspark code. You could create it via a dataflow and send the result to the Lakehouse. This exercise is all about trying to do everything using PySpark Code.
# Import necessary modules
import datetime
#from pyspark.sql import SparkSession
from pyspark.sql.functions import col, expr
from pyspark.sql.types import StructType, StructField, StringType, TimestampType

# Create a Spark session
spark = SparkSession.builder.appName("DateRangeGenerator").getOrCreate()

# Define your start and end dates
start_date = '2020-01-01'
end_date = '2027-12-21'

# Convert start and end dates to datetime objects
start_datetime = datetime.datetime.strptime(start_date, '%Y-%m-%d')
end_datetime = datetime.datetime.strptime(end_date, '%Y-%m-%d')

# Calculate the number of days between start and end
num_days = (end_datetime - start_datetime).days

# Generate date range
dfdate = spark.createDataFrame([(start_datetime + datetime.timedelta(days=i),) for i in range(num_days)], ['calendarDate'])

# Optional: Convert to timestamp
dfdate = dfdate.withColumn('timestamp', col('calendarDate').cast(TimestampType()))

# Show the resulting DataFrame
dfdate.show()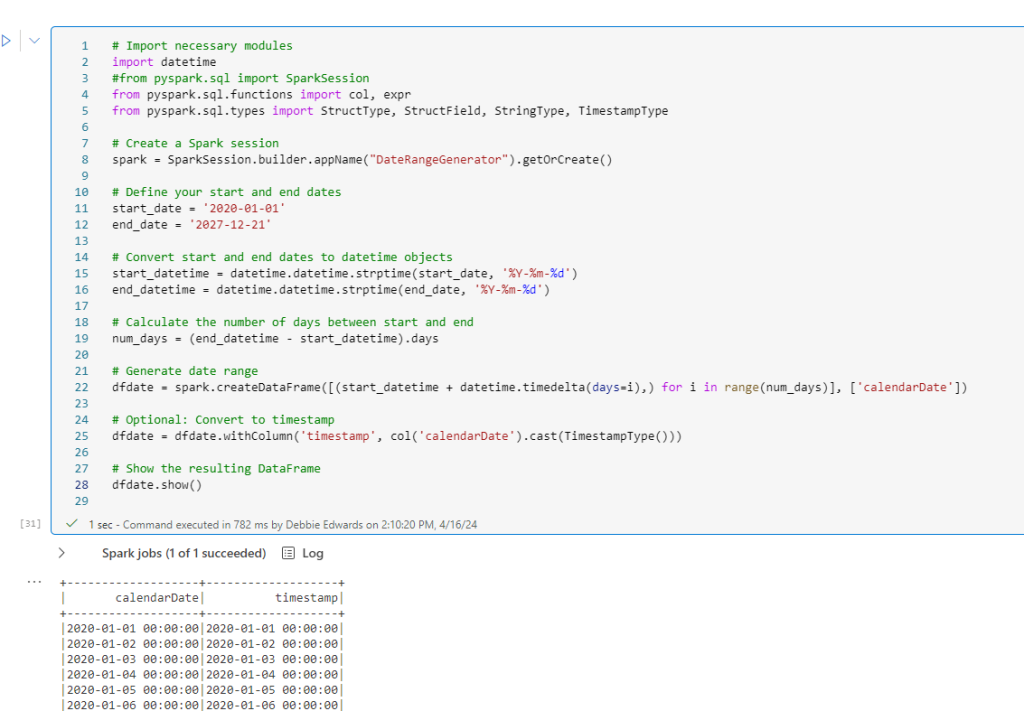
Lets look at this in more detail:
We import the necessary modules:
- import datetime datetime function is used to work with this format.
- from pyspark.sql import SparkSession These are the entry points for working with Data Frames. ( I don’t think we need this because a Spark session is already running).
- from pyspark.sql.functions import col, expr.
- col is a function and allows you to reference a column in a DataFrame by its name. E.g. col(“Column_Name”)
- expr is a function that allows you to execute SQL Like expressions with Pyspark.
- from pyspark.sql.types import StructType, StructField, StringType, TimestampType
- StructType is used to define a schema and represents a collection of fields.
- StructField are these fields in the StructType. And the fields in question are strings and timestamps
And now into the main Code block
- The Start_date and End_dates are defined and can be changed when necessary
- Both dates are converted into datetime format Year Month and Day
- Next we get the number of dates between start and end in .days
- Then the date_df is generated.
range(num_days)- Generates a sequence of integers from 0. Each of these integers represents the number of dates from the start date.
[(start_datetime + timedelta(days=i),) for i in range(num_days)]:- This creates a list of tuples (Tuples are used to store multiple items in a single variable) so if there is a week of days, i would be 7 and we would have 7 rows of dates.
- Finally we create another column which has been converted to timestamp. Which we will use moving forward.
Add Columns to DimDate
We are now going to set a range of columns up for Date
#You can have all the functions separated by a comma rather than repeating
from pyspark.sql.functions import year, month, dayofmonth, quarter,concat,lit, col, when, date_format #to get month name
# Create a new DataFrame with an alias for the 'timestamp' column
dfdate2 = dfdate.select(
dfdate.timestamp.alias('date')
).distinct()
# Add a new column 'year' by extracting the year from the 'date' column
dfdate2 = dfdate2.withColumn('year', year(dfdate2['date']))
#Add the month no
dfdate2 = dfdate2.withColumn('monthNo', month(dfdate2['date']))
#And the month Name
dfdate2 = dfdate2.withColumn('monthName', date_format(dfdate2['date'], 'MMMM'))
#Add the day of month
dfdate2 = dfdate2.withColumn('dayofmonth', dayofmonth(dfdate2['date']))
#Add Quarter as a number
dfdate2 = dfdate2.withColumn('quarterNo', quarter(dfdate2['date']))
#Add Q to the start of Quarter for Power BI
dfdate2 = dfdate2.withColumn("quarter", concat(lit("Q"),col("quarterNo")))
#Create financial year
dfdate2 = dfdate2.withColumn('financialYear',
when(dfdate2['monthNo'] >= 5, dfdate2['year']).otherwise(dfdate2['year'] - 1))
#Create season
dfdate2 = dfdate2.withColumn('season',
when((col('monthNo') >= 3) & (col('monthNo') <= 5), 'Spring')
.when((col('monthNo') >= 6) & (col('monthNo') <= 8), 'Summer')
.when((col('monthNo') >= 9) | (col('monthNo') <= 2), 'Summer')
.otherwise('Not known'))
# Show the resulting DataFrame
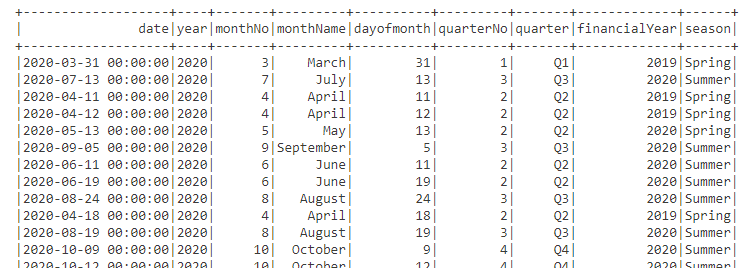
dfdate2.show(1000)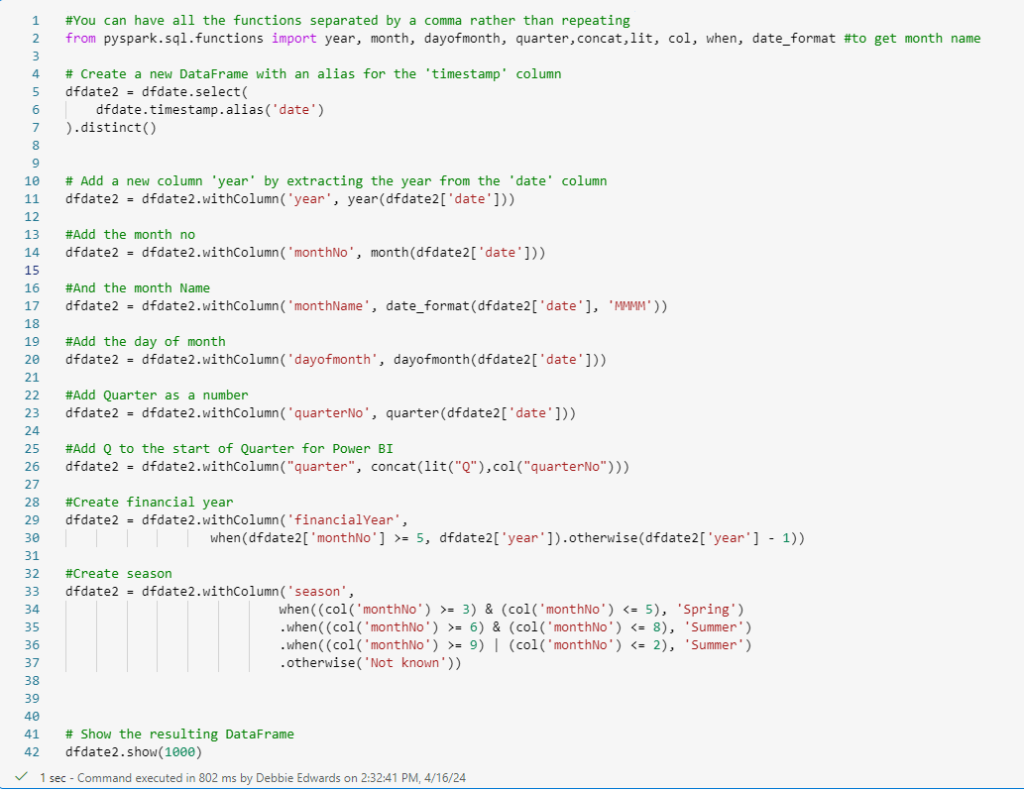
Create a current Day Flag
its always useful to have some date flags to use in Analysis
from pyspark.sql.functions import current_date, col

# Add a flag column indicating whether the date is the current day
dfdate2 = dfdate2.withColumn("currentDayFlag", col("date") == current_date())

# Show the result
dfdate2.filter(dfdate2['currentDayFlag'] == True).show()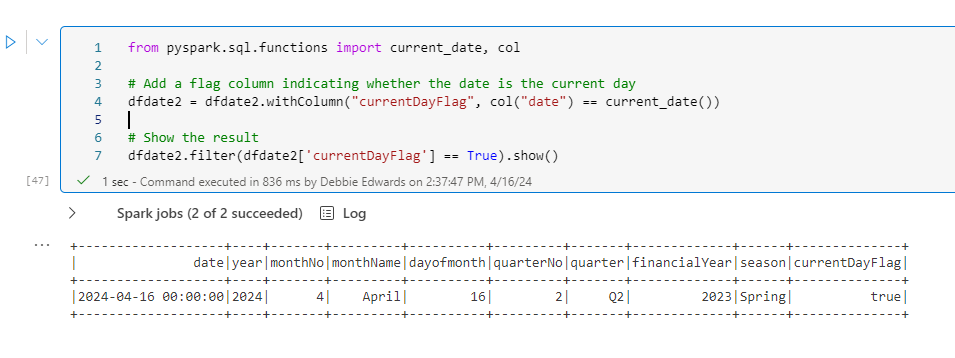
Note that we can now quickly look at the current date (this would need to be updated every day)
Create a current month Flag
from pyspark.sql.functions import month, current_date

dfdate2 = dfdate2.withColumn("currentMonthFlag", month(dfdate2['date']) == month(current_date()))

# Show the result
dfdate2.filter(dfdate2['currentMonthFlag'] == True).show()
Create a current year Flag
from pyspark.sql.functions import year, current_date

dfdate2 = dfdate2.withColumn("currentYearFlag", year(dfdate2['date']) == year(current_date()))

# Show the result
dfdate2.filter(dfdate2['currentYearFlag'] == True).show()
Create the Date Key
For this we need Year, Month and Day to create an integer key which will be recreated in the fact table
from pyspark.sql.functions import concat_ws, lpad, col

# Assuming you have a DataFrame named 'df' with columns 'year', 'month', and 'day'
dfdate2 = dfdate2.withColumn('DateKey',
                   concat_ws('', col('year'),
                             lpad(col('monthNo'), 2, '0'),
                             lpad(col('dayOfMonth'), 2, '0')).cast('int'))

dfdate2.show()
- lpad is used to left pad a string column
- concat_ws is used to concatename string columns into a single column
Save as Delta PARQUET and PARQUET
from delta.tables import DeltaTable

dfdate2.write.mode("overwrite").format("delta").saveAsTable("dimDate")
dfdate2.write.mode("overwrite").parquet('Files/Data/Silver/DimDate.parquet')
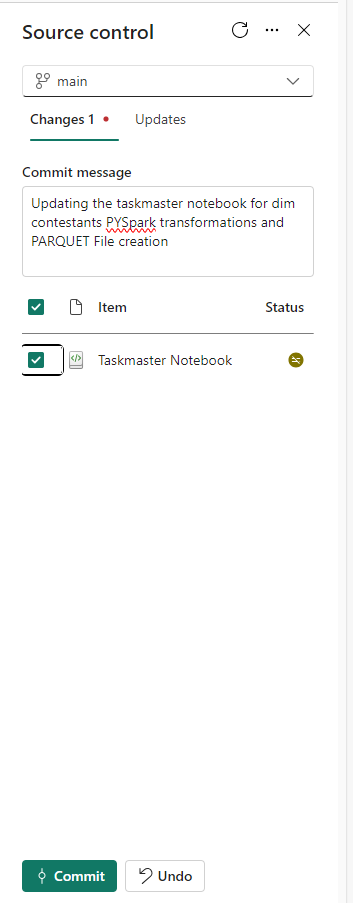
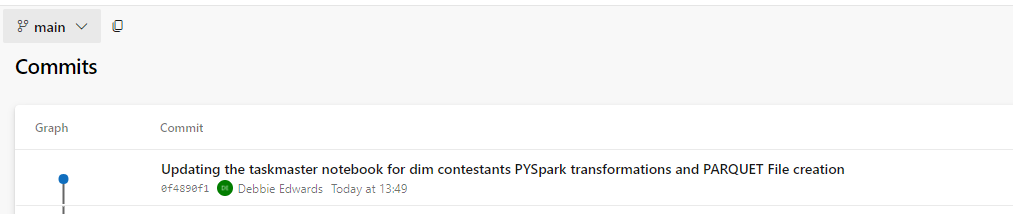
Update Source Control
Clicking back onto the Fabric Workspace. Make sure you update Source Control
Conclusion
In part three, we created individual notebooks for each dimensions.
We now have DimTask, DimEpisode, DimContestant and Dimdate
Next we want to start on the facts. And we want to revisit each dimension to see if we are happy with the types of each column.
Tell me what you would do? Would you have one notebook with everything in one? Or split up as I have done?
How would you deal with the importing of all the functions? Is there anything I can do better here?
Are there better ways of writing the code?
Part three and Im starting to really enjoy working with Pyspark. the takeaway is that I can use my SQL brain so its starting to really work for me.
So many questions though. for example, we can do full and appends to write the data but what about a more incremental approach?