
As ever with DAX, I tend to have to remind myself of the basic every so often, especially when i have bee concentrating on other topics.
We need to remember the following
Model Relationships propagate filters to other tables.

Product can be sold many times. (1 to many)
Have a look at the model in your Power BI desktop file

If you click on the join
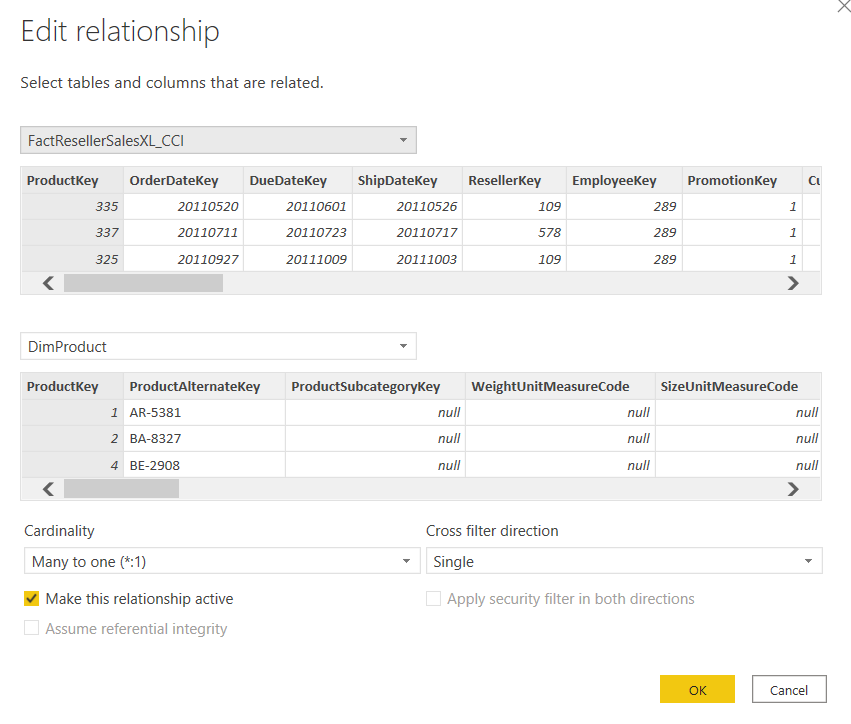
You can see Cross Filter Direction (In this case Single) We can Filter the measure within the fact table by, for example, Product Name. But we cant Filter Product Name by, for example Sales amount within the fact table
When you are looking at Measures you basically filter a measure by either an implicit filter or an explicit filter within the DAX.
Confusing? How can the above information not be?
Lets take this a step backwards by Looking at implicit filtering

using the above example we have taken Color from the Product table and Order Quantity (The Metric) from the Fact table
We implicitly Filter Order Quantity by colour. No need to specify anything in DAX
Implicit – Suggested though not directly expressed
CALCULATE
Lets create a measure
Order Quanity of Yellow Products = CALCULATE(SUM(FactInternetSales[OrderQuantity]),DimProduct[Color]=”Yellow”)
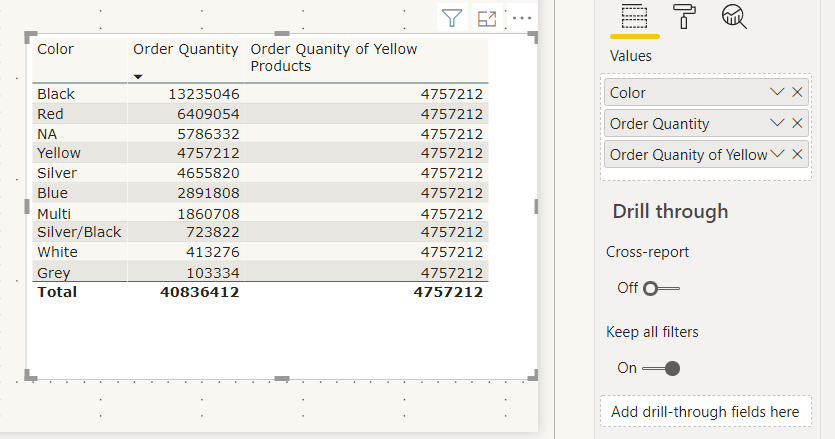
So here CALCULATE evaluates the summed value of Order Quantity, against the explicit filter of color = Yellow. So in the above visual, it ignores the implicit value of the Color filter within the visual.
Here is a nice reminder

If you drag a field into your visual its an implicit filter
If you set the filter within your DAX its an explicit filter and it will override what is in your visual
CALCULATE allows you to calculate a value against a context (The filter modification).
Lets change this slightly
Order Quantity of Yellow Products = CALCULATE(SUM(FactInternetSales[OrderQuantity]),ALL(DimProduct))
Now instead of Colour = “Yellow” We are saying Calculate against all Products

This time, note the total matches the total. this is because we are ignoring the colour context and Getting the total of ALL products
* quick sanity check. The visual isn’t quite right. The totals should be the same on the rows and the total column. This must simply be an issue with the visual I used here.
FILTER
Filter basically returns a table that has been filtered. Lets have a look at a FILTER Function used in very much the Same way as CALCULATE above
TOTAL Order Quantity Yellow colour = CALCULATE(SUM(FactResellerSalesXL_CCI[Order Quantity]),FILTER(DimProduct,DimProduct[Color]="Yellow"))
We are again calculating the sum of Order Quantity, with a Filter of Color = yellow. Lets look at how the visual changes

This time, instead of seeing the total for yellow against every other colour quantity, we only as see the measure against yellow.
the great thing about FILTER is that you can have more than one Filter as an OR
TOTAL Order Quanity Yellow & Black = CALCULATE(SUM(FactResellerSalesXL_CCI[Order Quantity]),FILTER(DimProduct,DimProduct[Color]="Yellow"|| DimProduct[Color]="Black"))

Now we can see Yellow OR Black Quantities
how about if we want to see only yellow products in 2014. FILTER comes in useful for this
TOTAL Order Quanity Yellow & Black = CALCULATE(SUM(FactResellerSalesXL_CCI[Order Quantity]),FILTER(DimProduct,DimProduct[Color]="Yellow"),FILTER(DimDate,DimDate[CalendarYear] = 2014))

This time, Not only are we only seeing Yellow product Quantity but the Quantity sold in 2014
FILTER is obviously slower than CALCULATE so if you are only filtering on one thing, go for CALCULATE.

hi,
I don’t understand this part –

Order Quantity of Yellow Products = CALCULATE(SUM(FactInternetSales[OrderQuantity]),ALL(DimProduct))
Why is the total order quantity = 60398?
LikeLike
yeah me the same I don’t get that part
LikeLike
Sorry. It’s clearly an issue with the Dax here. I don’t have time to check and it’s an old post but the correct Dax should show the same amount as the total.
LikeLike