
In Part 11 we created Power BI reporting and changed the usual PBIX to a PBIP Project file.
Before moving on, lets have a quick look at a new feature in Fabric. Task Flows
Back in the Fabric Workspace

We can now build a task flow. But what is it?
Its a new workspace feature to visualise the collection of processes for an end to end solution.
There are specific types of tasks that we will look at later
There are two ways of going about this.
- You have started a brand new project and you have your initial Task flow set up to start adding in tasks. This helps you work with your architecture,
- You have already created tasks (Like this project) and want to assign them to a task flow.
Lets begin


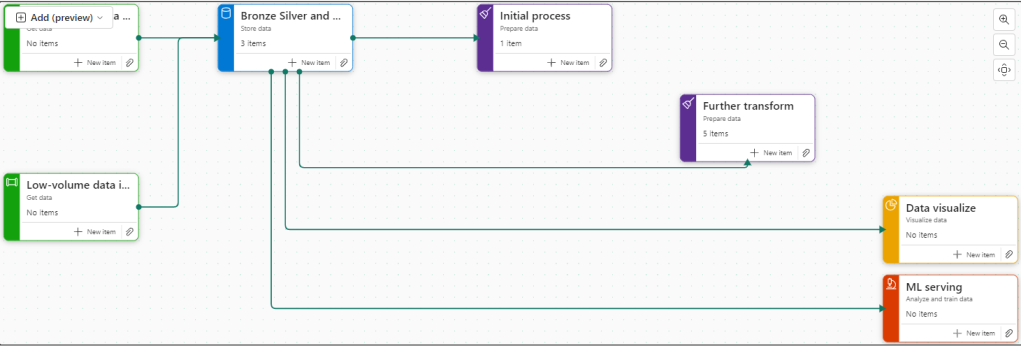
There are 8 flows available at the moment. Throughout the Fabric journey, the medallion architecture has been championed so lets go with this.

Colouring
- Green Items are Get data
- Blue Items are Store Data
- Purple items are Prepare data
- Yellow items are Visualise data
- Red Items are Analyse and train Data
Creating new Tasks
If you haven’t yet started. When you set up your board. you need to assign items to each task.
There are no Data Engineering steps in this development project for getting data so lets start with the green tasks.

Click New Item

And we get options of what to create for Low Volume data. Great. We have recommended items (which we can change to all) So if you wanted to go Low code a Data Factory Dataflow Gen2 might be the way to go.
lets have a look at high volume data
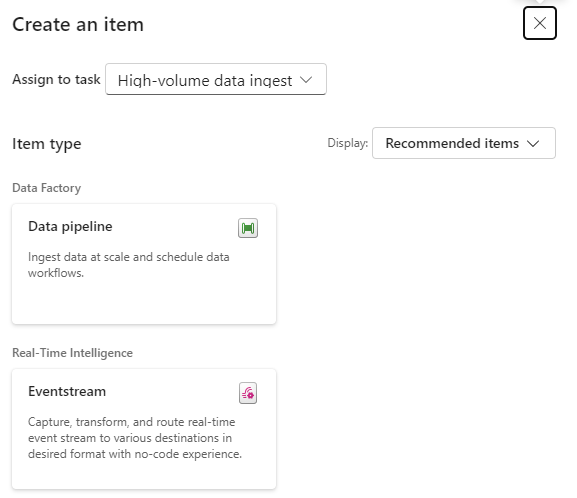
Here, a Data Pipeline would probably be used for this project.
Data Factory was previously the go to for copying files across into the Data lake so as the data engineer, I would possibly pick pipelines for both types of data processing.
Already this is a great way of working. We know we need to do all these processes but the amount of possibilities can be bewildering. So let Fabric give you recommendations every step of the way.
Assigning Items to a Task
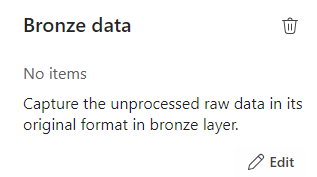
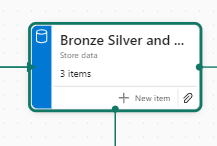
Bronze Data
If we quickly click new item to check the recommendations

We have already set up a Lakehouse for Taskmaster.

Click the little paper clip icon to attach a task

And Select the Lakehouse
Now we have 3 items at Bronze Data Level
- DebbiesFabricLakehouse Top Level
- The SQL Analytics Endpoint
- The semantic Model (default) This wasn’t used because there were issues with errors occurring whilst developing.
Selecting the Bronze data Task shows you the objects in that task.

Lets move on to
Initial process

We have a Data Engineering notebook set up that Creates our initial transformed Silver layer. This can be added here
One current real issue for me is the vertical bar on Fabric and Power BI

You have to go to the end to scroll down. And you can’t see your items. Extremely annoying when working on smaller screens. This is actually a large screen but you cant make the box any bigger. You have to manually make the columns smaller each time .
I hope they sort this out soon


What happens when you accidentally assign an item to the wrong task flow
I have added the Lake house to the initial Process accidentally.

Hover over the tasks and select the ones you want to remove

And Unassign from all Tasks which appears
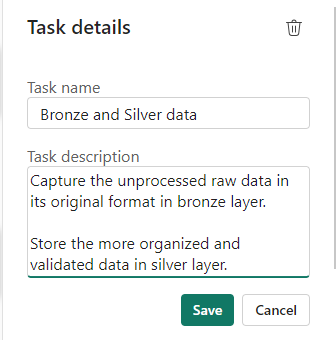
Silver Data

In this case the Lakehouse contains bronze and silver layer, so this is for both.
What happens when we assign the lakehouse to silver?
Well, you can’t do this. An item can only be for a single task. So how do we relate this to our medallion architecture above?
For the time being, go to Bronze Data and edit
Assign the Lakehouse
Click on Silver Data

Delete. We don’t need this
This leaves a gap in our flow
Connecting Tasks

Click the edge of the starting task and join to the end task
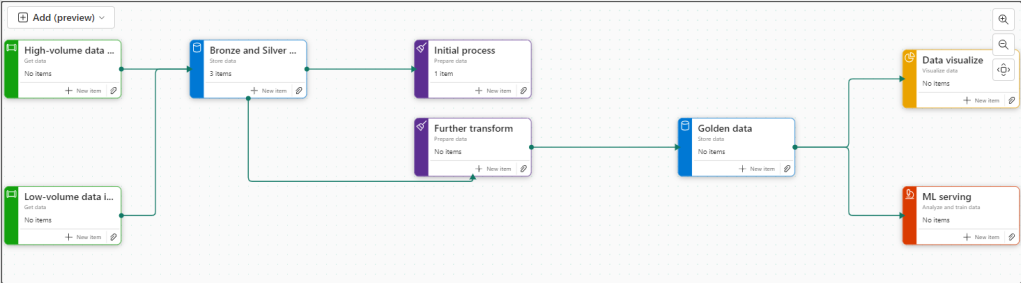
Further transformation
We have Notebooks that prep the dims and facts. Lets add them

Golden Data
Another Data Store and again our golden data is in Delta Parquet in the Lakehouse. Looks like we can edit the initial Store data again

Mini gripe. You can’t see all of the information so you cant tell its bronze silver and gold.
Delete Golden Data
Personally I would prefer to have all three on the pane and share the Data lake between all three tasks.
But where do we add the semantic model?
The Semantic model comes before visualising the data. But we have nowhere for this.
Creating paginated reports and semantic models from a task isn’t supported.
https://learn.microsoft.com/en-us/fabric/get-started/task-flow-overview
Well this is a real shame. it feels like this needs to be added before its a really usable solution.
Data Visualise

Our report is in a PBIX File.
We don’t have any Dashboards
Lets publish the Content from Pbix to the Fabric Workspace.
Then go back to the workspace

Interestingly these are now uncommitted items and show up in source control.

In Part 10 we did a lot of work getting the PBIX file into source control. What will this do? we will look at this later.
Back to Data Visualize

We add the reporting
The Semantic Model has also been added here, Hopefully a new task will be added soon specifically for the semantic model, there are currently no items types for semantic modelling.
There is no ML Service so we could get rid of this task.
Old Notebooks not being used (Filters).
There are a few Notebooks from the old version not part of this, can we see them?

Another issue. Selecting Not Specific for Task doesn’t filter the Tasks without a Task Specified. Something else that needs to be ironed out.
Conclusion.
There are currently a fair few issues with this but it is new and hopefully they will get ironed out.
I still don’t like scrolling in any of the Power BI / Fabric Service solutions because it doesn’t automatically resize to page size. This has been an annoyance for a long time now. I really wish it would get sorted.
Semantic modelling needs to be added. Filtering needs to be much better,
And I genuinely wish you could have an item in multiple tasks, especially store data. But overall I really love this feature and can’t wait to see if get some more development
