Having lived and breathed Microsoft for over 20 years, it is important to sometimes stop and think about all the changes over those years and all the growth and learning gained from each change to the analytics space.
I started working with on premises Microsoft Products. We had a large room full of Microsoft 2000 servers and a long journey to finally upgrade to 2008 R2.
Integration Services was the orchestration tool of choice and Reporting services (SSRS) was the server based reporting tool.
We were starting to move from basic management reporting into business intelligence, especially with the introduction of SQL Server Analysis Services that became part of the environment when we finally pushed to 2008 R2.
We have come along way since those days.
On Premises Analytics
One of the biggest issues with On Premises was the upgrading to new Servers. We had a lot of servers and applications tied to those servers. Upgrading to the latest release was never easy and sometimes couldn’t be done because of the system it supported.
This led to a real disparity of servers. Some still at 2000. Some 2008 R2. A few lucky ones moving to later versions.
Another big issue specially for the analytics team was the use of the servers. Spinning up a new database needed a lot of work to make sure that whatever was required wouldn’t run out of space or memory. Because there was only a certain amount of these resources for all services.
There were examples of simply not being able to work on a project because of these restrictions.
There is nothing more frustrating as a developer to know there are later releases out there but you are stuck on an old version. Or knowing that you could do so much more with a bit more compute power or space allocation. There was no room to grow. You had to understand your full limit and work from there.
Reporting Services (SSRS)
Its interesting to look back on SSRS, Microsoft’s Paginated reporting original solution after using Power BI for so long now.
Yes it delivered fairly basic paginated reporting but it didn’t quite deliver the experience we really wanted to go with for our new Business Intelligence vision.
On Premises to Azure
A career move presented me with the opportunity to start using Azure and Power BI.
Finally, the floodgates seemed to open and new possibilities seemed to be endless. Here are just a few examples of the changes happening at this point
- Azure allowing us to always be on the latest version. No more wishing that you could use SQL Server 2014 whilst stuck on 2008 R2.
- Power Bi, interactive data visualisation. The complete gamechanger. We will look at that more later
- Azure SQL Databases. Here we can now spin up small cheap solutions for development work. Scaling up as we go. Never needing to pay for more than we use. Even having the advantages of upping compute during peak loading times. Always being on the latest version, and so many possibilities of choice.
- Serverless SQL DB for example. Great for Dev and UAT. Only unpausing compute resources when you need them.
- We can still work with our SQL Skills building stored procedures to transform data.
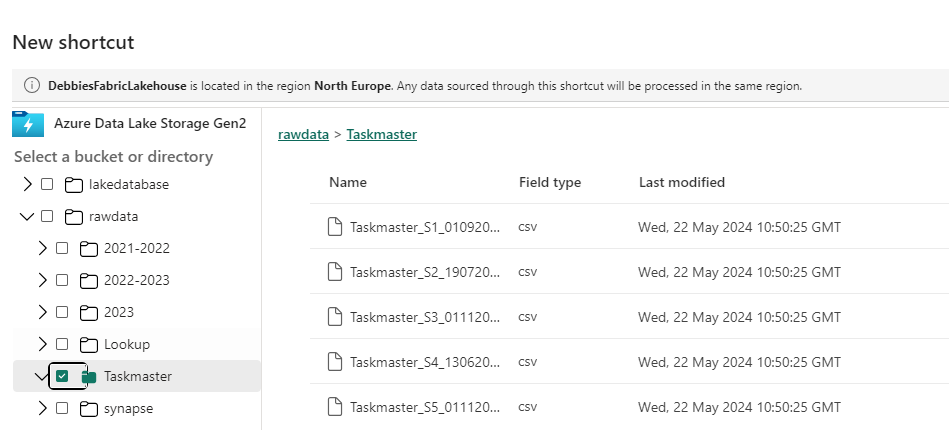
- Azure Data Lake. Secure Cloud storage for structured and unstructured data. A landing area for our data that also creates opportunities for our Data Science experts.
- Azure Data Warehouse (Which upgraded to Synapse in 2019) was the offering that allows for MPP Massively parallel processing for big scale data. Along with the serverless SQL Pools (Synapse) to finally give us the chance to do analysis and transformations on the data pre the SQL Database load.
- Data Factory. The Azure Data Orchestration tool. Another big gamechanger, offering so much more flexibility than Integration Services. Having a solution that can access Cloud resources and on premises resources. So much connectivity.
Power BI
Power BI is Microsoft’s modern analytics platform that gives the user the opportunity to shape their own data experience.
- To drill through to new detail.
- Drill down into hierarchies.
- Filter data.
- Use AI visuals to gain more insight.
- Better visuals
And at the heart of everything. The Power BI Tabular storage model. The Vertipaq engine, Creating reporting that can span over multiple users all interacting with these report pages. Each user sending queries to the engine at speed.
I have worked with Analysis Services in the past, along with SSRS. Creating Star Schemas sat in columnar storage without needing to set up Analysis Services was a huge win for me as it was a much easier process.
Of course, you can’t talk about Power BI without understanding how different each license experience is. From the Power BI Pro Self Service environment, through to Power BI Premium Enterprise Level License.
There has been a lot of changes and Premium continues to create fantastic additional functionality. Premium sits on top of the Gen 2 Capacity offering larger model sizes. More compute. Etc.
As a take away. When working with Pro, you should always work with additional Azure resources, like Azure SQL DB, Integration Services etc to get the best end product.
With Azure and Power BI we have worked with the recommended architectures and produced quality analytics services time and time again. But, there were still some issues and pain points along the way.
And this is where Fabric comes in.
Fabric
Fabric is the (SaaS) Software as a Service Solution, pulling together all the resources needed for analytics, data science and real time reporting. Fabric concentrates on these key areas to provide an all in one solution.
On the whole, for an analytics project, working with customers, our (basic) architecture for analytics projects was as follows:
- Extract data into a Data Lake using Integration Services on a Schedule
- Load the data into SQL Server Database
- Transform the data into STAR schema (Facts and Dimensions) for Power BI analytics
- Load the data into Power BI (Import mode where ever possible. But obviously there are opportunities for Direct Query, and Composite modelling for larger data sets)
We can see here that the data is held in multiple areas.

Synapse starts to address this with the Serverless SQL Pools. We can now create Notebooks of code to transform our data on the file itself. Rather than in the SQL Database on the fully structured data.
Fabric has completely changed the game. Lets look into how in a little more detail.
Medallion architecture
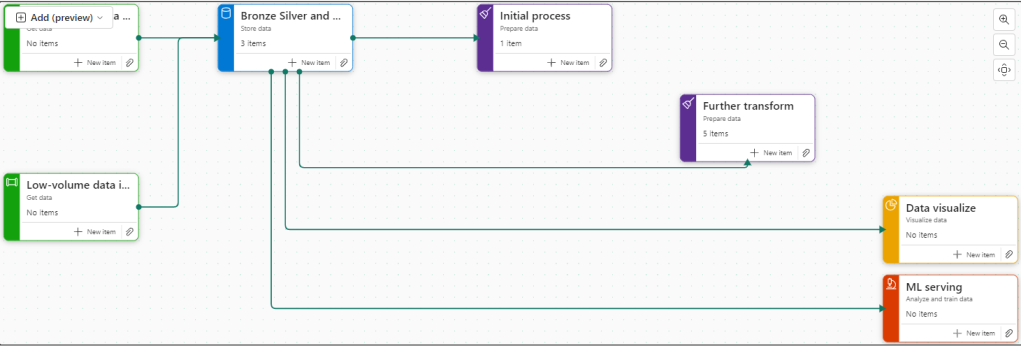
First of all, we need to understand the architectures we are working with. The medallion architecture gives us specific layers
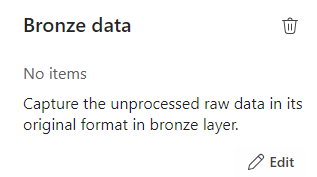
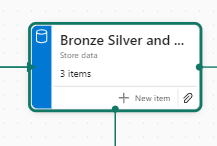
- Gold – Our landing area. The data is added to the lake. As is. No Processing
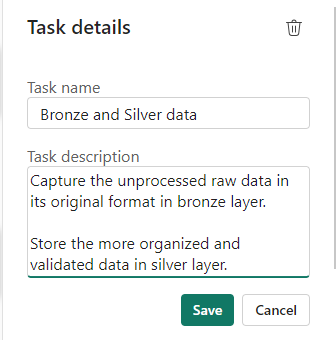
- Silver – The Data is transformed and Processed
- Gold – the data is structured in a way that can be used for Analytics. The Star schema for Power BI.
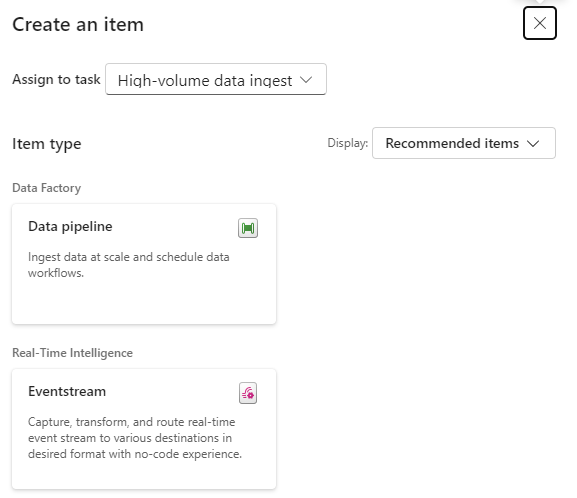
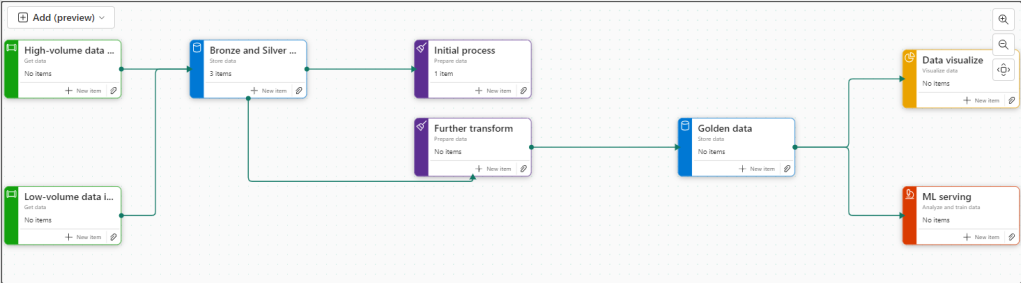
Fabric allows us to work with the medallion architecture seamlessly. And as announced at Microsoft build in May of this year. We now have Task Flows to organise and relate resources. The Medallion architecture is one of the Flows that you can immediately spin up to use.

Delta Lake
The Delta lake enhances Data Lake performance by providing ACID transactional processes.
A – Atomicity, transactions either succeed or fail completely.
C – Consistency, Ensuring that data remains valid during reads and writes
I – Isolation, running transactions don’t interfere with each other
D – Durability, committed changes are permanent. Uses cloud storage for files and transaction logs
Delta Lake is the perfect storage for our Parquet files.
Notebooks
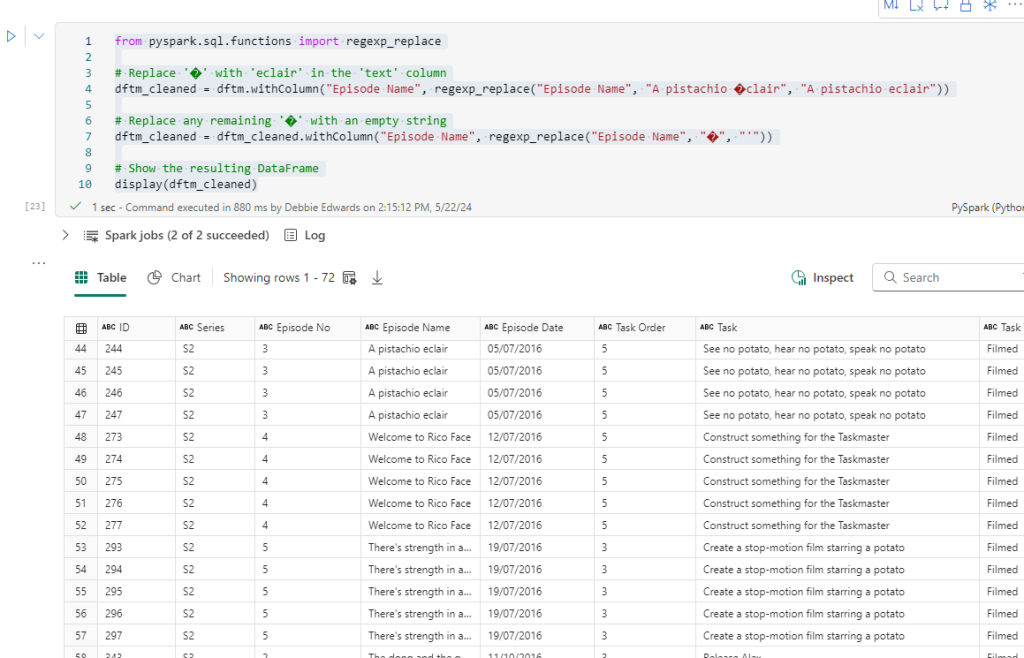
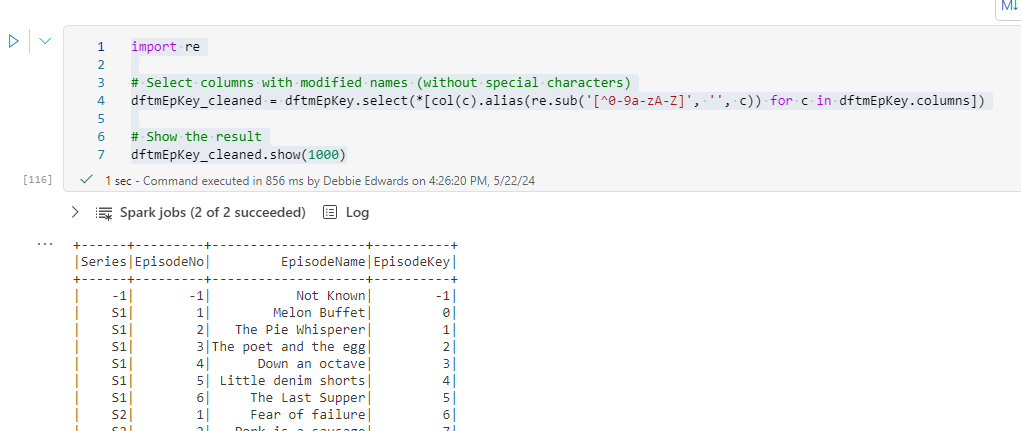
Used to develop Apache Spark jobs so we can now utilise code such as Pyspark and transform the data before adding into a new file ready to load.
Delta Parquet
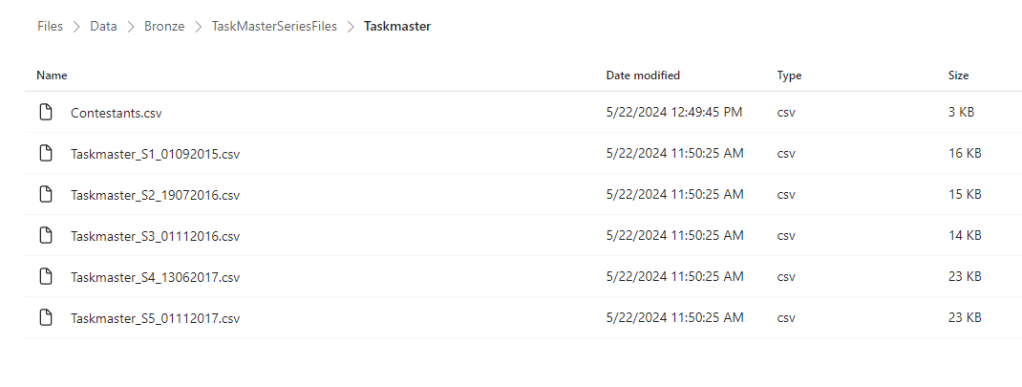
Here is where it gets really interesting. In the past our data has been held as CSV’s, txt etc. Now we can add in Parquet files into our architecture.
Parquet is an open source, columnar storage file format.
The Power BI data model is also a columnar data store. This creates really exciting opportunities to work with larger models and have the full suite of Power BI DAX and functionality available to us.
But Fabric also allows us to create our Parquet Files as Delta Parquet, adhering to the ACID guarantees.
The Delta is and additional layer over Parquet that allows us to do such things as time travel with the transaction log. We can hold versions of the data and run VACUUM to remove old historical files not required anymore.
Direct Lake Mode
Along with Parquet we get a new Power BI Import mode to work with. Direct Lake allows us to connect directly to Delta Parquet Files and use this columnar data store instead of the Power BI Import mode columnar model.
This gives us a few advantages:
- Removes an extra layer of data
- Our data can be partitioned into multiple files. And Power BI can use certain partitions. Meaning we can have a much bigger model.
- Direct Query, running on top of a SQL DB is only as quick as the SQL DB. And you can’t use some of the best Power BI Capabilities like DAX Time Intelligence. With Direct Lake you get all the functionality of an Import model.
SQL Analytics Endpoints
If you are a SQL obsessive, like myself you can analyse the data using the SQL analytics endpoint within a file. No need to process into a structured SQL Database
Data Warehouse
Another one for SQL obsessives and for Big Data reporting needs. There will be times when you still want to serve via a structured Data Warehouse.
Conclusion
Obviously this is just a very brief introduction to Fabric and there is so much more to understand and work with. However using the Medallion architecture we can see a really substantial change in the amount of data layers we have to work with.

And the less we have of data copies, the better our architecture will be. There are still a lot of uses for the Data Warehouse but for many smaller projects, this offers us so much more.
Its been a long journey and knowing Microsoft, there will be plenty more fantastic new updates coming. Along the way, I would say that these three ‘jumps’ were the biggest game changes for me, and I can’t wait to see what Fabric can offer.
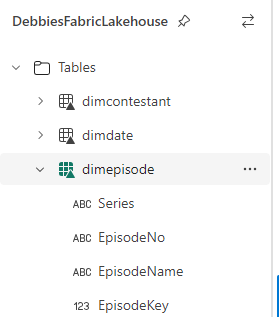
And remember, always use a STAR schema.
*first published on TPXImpact Website