After 14 years using Microsoft On Premise BI Tools (SQL Server, Reporting Services, Integration Services and Analysis Services) Its time to embrace Business Intelligence in the cloud.
We have been working with Power BI Premium for a few weeks. Simply switching it on and seeing how it goes.
However, Its worth paying some attention to Autoscaling that you can get with Premium Gen 2 (Preview)
Auto Scaling
Previously our Power BI Premium capacity could struggle when there was high capacity. For example If we reached full capacity, someone’s automatic refreshes would fail. Or if too many things were happening on the server, report users would find that reports were taking longer to render.
There are lots of use cases where this could happen so Auto scaling is definitely something that can help with these issues.
You can now scale and autoscale using Azure Pay as you go, which is around £62 per vCore for a 24 hour period
We use the DTU Pricing structure in Azure for SQL DBs. What is the difference between the DTU and the vCore pricing structure?
Autoscaling is an opt in feature and can be charged to an Azure Subscription
Once the spike is over, scale down happens and you stop paying for the scale up.
Autoscale Notifications
Toasts pop up in Admin Portals Capacity Settings to let your admin know when autoscale is running.
It would be good to be able to tell everyone working with Power BI when this is happening simply for reference
Get Started with setting up Autoscaling in Azure
Go into Azure and Select Subscriptions. You need to have made the decision before hand on which subscription can be used for Autoscaling billing.
Next create an auto scaling resource group
Enable Autoscale in Power BI Admin Portal
To do this you need to be the Power BI Admin (Or Global Admin)
Another addition is that the person needs to be at least a contributor on the Azure Subscription to go through all the steps succesfully
Go to Capacity Settings
Make sure Premium Generation 2 is already enabled
Then Select Manage Auto Scale
Enable auto scale and then select your Azure Subscription
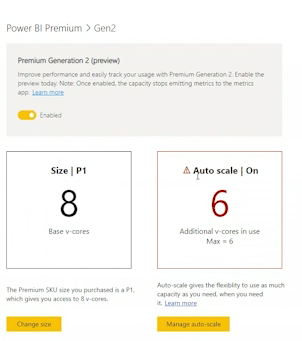
And then assign the number of vCores to the Autoscale
Here we have set the max of 2.
How many vCores does a Premium P1 capacity have?
8 virtual Cores
Once completed you are all set. There are some questions. Apart from the Toast pop ups are there other ways to monitor and log the usage of Autoscaling?
The big takeaway from all this is that we should never be in a situation where we are surprised that we have reached capacity. Or, if we do set up Auto Scaling it should not be used on a day to day basis.
More investigation is needed on how to set up proper monitoring so we have full knowledge about what is going on in Premium Capacity. And we must never forget that there will be Pro workspaces already set up and these shouldn’t go under the radar either.
We will have a look at these issues in future posts
It can be quite infuriating to be a Power BI Pro user and constantly be on the verge of doing something, before realising that its only available with Premium.
Thank goodness for Power BI Premium Per User for smaller companies. At just double the price per user licence, all these enterprise level goodies can be available. I wanted to do a whistle stop tour of each one, and some others I have found along the way
Automated Machine Learning
No code machine learning is great if you arent a data scientist and you want to try out some basic machine learning.
For this example I have gone to my dataflow in Power BI Service
I am going to use my date dataflow just as an example, but obviously this isn’t the datasource you would want to use
I wont go any further with this example as its not a great one but I just wanted you to get a feel of the first few screens. This is an incredibly powerful feature. once set up you can use this dataflow in Power BI.
You can also integrate Azure ML models that your data scientists have created in Azure with the Azure ML API
Cognitive Services
I have previously used Cognitive Services in Azure to add sentiment analysis and key phrases onto tweets as they come in via an Azure Logic App trigger.
This information is then loaded into Power BI Pre prepared.
I have struggled to access this functionality within Power BI previously but hopefully this will allow Power BI users proper access to this fantastic Azure Service
Within Power BI Query Editor (Dataflows in Service)
If you are in Pro you will see the following
With Premium however you can use the following functions
Just a couple of examples, you can take descriptive data and score it with ScoreSentiment. Then you can take these scores and add a new column for Sentiment (Positive, Negative, Neutral)
You can add a language field that will tell you if your test item is for example, English, German, French etc.
And you can extract key phrases from descriptive text to add a cool word cloud to your power BI report.
No code data prep and scale
Visual Data Prep is another area that needs looking at in more detail but this is available in Premium dataflows
You now get a great diagram view of all the actions done on your queries.
This will make things much easier for users who can now interact with the diagram view.
Deployment pipelines
Assign your development App Workspace and Pipelines will then let you create Test and Production App Workspaces. Each workspace can be pointed to different data sources.
You can then very easily work in development. move your work to test and then to production when its ready to use.
As at April 2021 Dataflows haven’t yet been added but once this is in, I think this is really the only way to go with Power BI.
Having done some research on Dev Test and Prod in Power BI Pro this makes a huge difference as its practically unworkable in Pro
Integration with Azure Synapse
Azure Synapse is the new Azure Data Warehouse.
You can now create Power BI reports over big data in Azure Synapse.
And Azure Synapse gives you even bigger wins with performance
Pixel-perfect paginated reports
Report Builder is free. You can download it and even use a model previously created in Power BI.
Here you can build your Pixel Perfect reporting, invoices are a good example. Reports that require page numbers and headers and footers that are most likely to be printed out.
Without Premium you cant publish the rdl files to the Power BI Service.
With Premium, you can publish your pixel perfect report to service along with your other Power BI objects
XMLS read/write
These Endpoints allow other providers access to your Analysis Services Engine within the Power BI Service. This means that you will be able to use even more tools for governance, monitoring, debugging, modelling etc, rather than only being able to use Power BI Desktop.
Your admin does need to allow this within the Admin Portal
Trillions of rows
With Premium, you can query and analyse 1 trillion rows of data. which is part of the ‘query performance over big data’ feature. In fact any large data set can make use of this feature to make refreshes and response times quicker
This is worthy of a more deep dive feature in future but its certainly exciting.
Advanced Security
Here are some of the advanced security features that can be used for your most sensitive data
Compute isolation
Double Encryption at Rest
Double Encryption in transit
Private links
Zero egress
Immutable logs
TLS 1.2
Customer Managed Keys
VNet Network isolation
Immutable storage logs
FedRAMP high & DISA IL4
DISA IL5, DISA IL6 + IDC503
Vulnerability management
Automatic Certs rotation
End to End protection
Sensitivity labelsand Microsoft Information Protection (MIP)
Sensitivity labels allows you to classify your data across all Microsoft products like power BI, Excel etc.
Its an extra cost and can be purchased standalone or through a Licensing suite like the Microsoft 365 Compliance Plan, Microsoft 365 Business etc.
For pricing you need to contact Microsoft at this time.
Other findings
If you are using dataflows in Pro, you cant create computed entities such as referencing tables. Merging tables.
This means that dataflows in Pro need to be quite simple. you only get the full functionality in Premium.
This is why most people in Pro prefer to do the data prep in Power BI desktop.
Its becoming more and more difficult for business users to remain with Power BI Pro, all these above features are an absolute must for enterprise level reporting.
It is really worth that switch to either Power BI Premium per user or a Premium node if you are a large enough company
Direct Query for Power BI datasets and Analysis Services feature has currently been in preview for a couple of months
Switching this feature to on, should hopefully allow us to create reports over multiple data sets, which will allow use to have smaller datasets, maybe just over a single model. These can then be connected together in the report
And we couldn’t wait to try it out.
We had two data sets. And for one report we wanted to connect to both datasets so we could create reports over the two, without having to create an entirely new larger data set.
However we ran into issues which ended up rendering this unfit for purpose
None of the formatting was remembered from the original datasets
All the folders had disappeared that had been set up in model view
All the Sort by items had gone.
Both models connected to a data dimension, but actually removing one of the date dimensions (from the second model) and connecting the second model to the first models data dimension didn’t seem to work very well.
We have lots of use cases where this would be perfect. so in the March update, it is mentioned that the team have been working on this. Lets have a look at see if this is now a viable option for us.
The source data sets
Data set 1
We have some folders for the measures
In the date dimension, month has the sort order of Month No
Seasons has the sort order of Seasons order
And we have a measure set as a Percentage (An example of formatting)
Data set 2
We have again, Folders, Sort orders and Formatting.
Both datasets have a date dimension
lets look and see what happens if we use Direct Query for Power BI datasets and Analysis Services
Remember to turn it on as a preview feature in options and settings
Get data
Choose a dataset (That has been published to an app workspace
Go to model view and remember to upgrade the model view
Issue with layout views
At this point, one of the key issues is that in the shared dataset pbix file, the developer has created multiple layouts in model view to make it easier to work with.
In the report pbix file all the layouts are lost and we are left with the All tables layout.
Not good because the report developer has to redo this work again in this report file
So here is the first model
Import data set 2
we can now get data from another Power BI dataset even though we are connected up to a dataset. Previously you could only connect to one data set.
What does this mean?
With one data set its a live connection, in the same way as you would live connect to analysis services. with Live connection there is no local model.
Direct Query. Direct Query needs a local model adding into the report so in this case, a dataset also gets published to Power BI Service, along with the report.
From this in Power BI Service
To this
Select Add a Local Model
And select the next data set
In this case we are happy with the security because both data sources are within the same workspace and we trust the owners and admins in this workspace.
Click OK
As the report developer I am now looking at quite a complex model in all tables.
The colours denote the two data sets.
Now we need to establish which tables are in twice.
Immediately we can see date and date 2 and these need conforming
You cant delete a table. All you can do is hide it in report view.
In this case date 2 is being hidden (Hide in report View)
And a join is being created between the metrics table in data set 2 and the date table in dataset 1
Remember that you will need to go over your model. Find every table that is being used across the models. Hide duplicates and create relationships
Check for issues
The date table in data set 1 has the above Sorts applied and they are still working in the report
The measures folders are still available in both dataset 1 and 2
However Formatting has been lost on the Percentage measure.
So this leaves us with one major issue across datasets, and we can’t reset all the formatting within the reporting pbix file
As it stands then this is currently not fit for purpose and just needs another extra tweak. Its a real shame because we were really hoping to use this very soon. Hopefully Power BI Sorts it out in the next release.
How do you do schema changes to your model without refreshing the entire model?
This is especially applicable for large models using incremental refresh where refreshing the entire data set takes a long time to process.
The ALM toolkit really helps with this process
The examples I am going to use aren’t incremental refresh but it will hopefully give some idea on how to use the ALM toolkit
And a big proviso here. You can only do this with Premium workspaces
Source
Open your model in Power BI desktop. From here go to External tools and open the ALM Toolkit (Ensure you have the latest version of the AML toolkit downloaded)
The source has already been populated against the open model. We now need to set the target
Target
Go to the service. Workspace Settings.
At this point the workspace needs to be in Premium
You need to copy the workspace Connection which is only available in Premium. Once copied, add into Workspace
We can see that the pbix file and the data set in service are identical. ‘Same Definition‘
Lets make some changes
Adding a new measure
add a new measure in your desktp pbix dataset.
Total Product Standard Cost = SUM(FactResellerSales[ProductStandardCost])
And back to ALM toolkit.
Before continuing, go into Options
Make sure that the Processing Option is default and that we are only going to process affected tables
For table updates, retain partitions should be checked, This is very specific to Power BI Incremental loading. Incremental loading works with partitions and we don’t want ALM toolkit to go to the database and affect any of the partitions ‘For example you could have a partition for every year’
Click Compare
And then Select Actions
Hide Skip objects will get rid of everything that hasn’t changed.
Now we can see the one new measure
We want to add the new measure without completely refreshing the data set
Then go to Update
Are you sure? message is returned
Quick note on XMLA Endpoints
At this point you need to have Read Write enabled on the XMLA endpoint
“XMLA endpoints enable open-platform connectivity to Power BI datasets. With these capabilities, customers can leverage a single one-version-of-the-truth semantic model across a range of data-visualization tools”
To do this you need to be the Power BI Admin or global Admin. In Admin Portal > Capacity settings > Workloads > XMLA Endpoint = read Write
If the next step doesn’t work you may need to speak to your Admin about the above. this is because we are using an external tool to update the schema.
When I tried this, I didn’t notice errors but the changes started to add up as I went along the process.
Back to the Update
Click OK to are you sure? and the measure is quickly updated. the database wasn’t read or updated. All that happened was a quick schema update.
Why would you want to run an upload, full or Incremental for new measures? this is the perfect way of introducing those new measures as quickly as possible.
Adding a calculated Column
Adding calculated columns aren’t advised because they don’t get compressed in the tabular database, Its always worth doing this in Power Query Editor or ideally in your source reporting database.
Back in the desktop file
A simple calculated column is created.
In ALM toolkit go back to Options
Again, the following options should be set
Then go to Compare. Select Actions and Hide Skipped Objects
And here is the new calculated Column.
Next click Validate Selection
If we were working with Incremental refresh and partitions you would see all your partitions here along with the above information.
If you have these partitions when you update you will see a process message, but don’t worry, it hasn’t done any data processing at the source, its simply added the new column and processed only within the model.
You can go into Power BI Service and do a quick Edit on a report,
drag the new column in to see that there is data for that column, but nothing else has been processed.
Adding new tables or new columns at source or in Power Query Editor
In this case we actually need the data to process.
The measure just needed the DAX to be added to the model.
The calculated column simply used the data already within the data model without doing a process.
For this new logic we do need to process the data.
Back in the ALM toolkit you need to untick, for table updates retain partitions because we now need to pull the data in for all the partitions and process all that data.
Process only affected tables is an important option here, We don’t want to process anything but the new table or column.
Once you have the settings set above you can go on to validate and update. And importantly this time the new data will be processed into the model, rather than just a schema change.
And every partition will be processed on an incremental load because of the change to the settings.
This is an excellent way of dealing with updates on large models but its important to note
Only available for Premium
Ensure Admin Settings – Read Write enabled on the XMLA endpoint
The analysis is performed at the record level of the ‘table’ A field in explain by is not on the ” table or a table from the same data source and related to it by a many to one relationship. Try Summarising it
This model is all about behaviour and attitudes for an event company who put on IT events for companies who want to learn more about cloud based solutions.
The stakeholders are all the people who go on the courses, and those people who arrange the courses.
Its important for the company to know how their customers are reacting to their cloud based events and training. Which ones are doing well or not in terms of reactions.
The trainer or presenter sends out a questionnaire after ever event / course. they also send in their own questionnaire about how they felt the course was engaged with.
I have a Star Schema and in one of the dimensions I have a behaviours table. We want to know what influences behaviour from all the other attributes from around the star schema
There can only be a certain number of behaviour types so this dimension is set as a junk dimension. Each Type of behaviour is joined to the other using a cartesian Join
Every behaviour type is matched to every other behaviour type and then we can simply assign the correct row to the person event and theme
So a stakeholder can go to many events
A stakeholder can hold different behaviours for every event
We want to see what effects behaviour, so the Key Influences visual is the one we really want to use in this project
In this visual we are analysing by Explain by.
Add in a measure from the fact table and it works fine
But this isn’t telling us anything. We need descriptive information from the other dimensions
So lets go for something from Events
And here is where we get the error
The analysis is performed at the record level of the ‘table’
Obviously this part of the error makes sense because we want to understand the behaviour
A field in explain by is not on the ” table
That is correct. we are explaining by a field in another dimension
or a table from the same data source and related to it by a many to one relationship.
Try Summarising it
How to deal with this issue
the error doesn’t give much away but the solution lies in the model.
The recommended single direction join has been used on every single relationship. Therefore, the dimension can filter the fact but the fact cant filter the dimension.
And specific to this model, Another dimension cant filter another dimension
Events and behaviour cant filter eachother.
Unfortunately setting all the relationships to both didn’t resolve the issue either. Maybe the answer lies with DAX
Lets look at that error again
the Keyword in the error is SUMMARISE.
Now we know exactly what we want to use as the ‘Explain by’ Lets see if we can set up a Summary table using DAX
Power BI Pipelines are a Premium Service which allows you to set up a development, QA and Production workspace and easily send your development changes across to the workspaces.
Each workspace can also be configured to work with different data sources. for example, your Dev Power BI may sit on top of test data, rather than the production data.
Because this is only available in Premium, we wanted to look into how difficult this process is outside of the Premium capacity.
Setting up the Development database
I wanted a poc development database for Power BI to work with. I’ve chosen household pets, with a bit of a surprise in Production.
CREATE TABLE [dim].[Pet](
[PetKey] [int] IDENTITY(1,1) NOT NULL,
[PetDescription] varchar NULL
) ON [PRIMARY]
;
CREATE TABLE [fact].[Petmetrics](
[AreaKey] [int] NOT NULL,
[PetKey] [int] NULL,
[PopulationwithPetsPerct] [int] NOT NULL,
[HouseholdswithPets000s] [int] NOT NULL,
[Petsperhousehold] [numeric](2, 1) NOT NULL,
[Petsperregion000s] [int] NOT NULL
) ON [PRIMARY]
;
Insert into dim.Area (AreaDescription)
SELECT 'North East' UNION
SELECT 'North West'UNION
SELECT 'Yorks and Humb'UNION
SELECT 'East Midlands' UNION
SELECT 'West Midlands' UNION
SELECT 'East'UNION
SELECT 'London' UNION
SELECT 'South East' UNION
SELECT 'South West' UNION
SELECT 'Wales' UNION
SELECT 'Scotland' UNION
SELECT 'Northern Ireland' UNION
SELECT 'UK' ;
Insert into dim.Pet (PetDescription)
SELECT 'cat' UNION
SELECT 'Dog';
WITH CTE_DOGS (AreaDescr, PopulationwithPetsPerct,HouseholdswithPets000s,Petsperhousehold,Petsperregion000s)
AS
(SELECT 'North East', 33 , 425, 1.3, 544 UNION
SELECT 'North West', 27, 825, 1.3, 1053 UNION
SELECT 'Yorks and Humb', 22, 545, 1.4, 773 UNION
SELECT 'East Midlands', 31, 750, 1.5, 1111 UNION
SELECT 'West Midlands', 28, 635, 1.3, 803 UNION
SELECT 'East', 21, 585, 1.4, 810 UNION
SELECT 'London', 92, 312, 1.1, 340 UNION
SELECT 'South East', 25, 950, 1.4, 1320 UNION
SELECT 'South West', 28, 674, 1.4, 940 UNION
SELECT 'Wales', 30, 460, 1.4, 647 UNION
SELECT 'Scotland', 23, 547, 1.5, 820 UNION
SELECT 'Northern Ireland', 40, 302, 1.4, 430 UNION
SELECT 'UK', 26, 6604, 1.4, 9000 )
INSERT INTO [fact].Petmetrics
SELECT a.AreaKey, (SELECT PetKey FROM dim.Pet Where PetDescription = 'Dog') AS PetKey,
d.PopulationwithPetsPerct,d.HouseholdswithPets000s,d.Petsperhousehold,d.Petsperregion000s
FROM CTE_DOGS d
INNER JOIN dim.Area a ON d.AreaDescr = AreaDescription
WITH CTE_CATS (AreaDescr, PopulationwithPetsPerct,HouseholdswithPets000s,Petsperhousehold,Petsperregion000s)
AS
(SELECT 'North East', 14, 195, 1.5, 286 UNION
SELECT 'North West', 16, 520, 1.6, 795 UNION
SELECT 'Yorks and Humb', 19, 443, 1.6, 680 UNION
SELECT 'East Midlands', 20, 480, 1.8, 854 UNION
SELECT 'West Midlands', 17, 400, 1.7, 662 UNION
SELECT 'East', 20, 512, 1.8, 876 UNION
SELECT 'London', 14, 428, 1.5, 580 UNION
SELECT 'South East', 20, 890, 1.8, 1422 UNION
SELECT 'South West', 21, 514, 1.6, 810 UNION
SELECT 'Wales', 22, 360, 1.7, 596 UNION
SELECT 'Scotland', 15, 381, 1.6, 590 UNION
SELECT 'Northern Ireland', 14, 106, 1.5, 160 UNION
SELECT 'UK', 18, 4995, 1.6, 8000)
INSERT INTO [fact].Petmetrics
SELECT a.AreaKey, (SELECT PetKey FROM dim.Pet Where PetDescription = 'Cat') AS PetKey,
d.PopulationwithPetsPerct,d.HouseholdswithPets000s,d.Petsperhousehold,d.Petsperregion000s
FROM CTE_CATS d
INNER JOIN dim.Area a ON d.AreaDescr = AreaDescription
Setting up the Production database
For this example the Production database is on the same server but it is likely to be on a different server. Not only that but a different Subscription in Azure
CREATE TABLE [dim].[Pet](
[PetKey] [int] IDENTITY(1,1) NOT NULL,
[PetDescription] varchar NULL
) ON [PRIMARY];
CREATE TABLE [fact].[Petmetrics](
[AreaKey] [int] NOT NULL,
[PetKey] [int] NULL,
[PopulationwithPetsPerct] [int] NOT NULL,
[HouseholdswithPets000s] [int] NOT NULL,
[Petsperhousehold] [numeric](2, 1) NOT NULL,
[Petsperregion000s] [int] NOT NULL
) ON [PRIMARY];
Insert into dim.Area (AreaDescription)
SELECT 'North East' UNION
SELECT 'North West'UNION
SELECT 'Yorks and Humb'UNION
SELECT 'East Midlands' UNION
SELECT 'West Midlands' UNION
SELECT 'East'UNION
SELECT 'London' UNION
SELECT 'South East' UNION
SELECT 'South West' UNION
SELECT 'Wales' UNION
SELECT 'Scotland' UNION
SELECT 'Northern Ireland' UNION
SELECT 'UK' ;
Insert into dim.Pet (PetDescription)
SELECT 'Lion' UNION
SELECT 'Wolf';
WITH CTE_DOGS (AreaDescr, PopulationwithPetsPerct,HouseholdswithPets000s,Petsperhousehold,Petsperregion000s)
AS
(SELECT 'North East', 33 , 425, 1.3, 544 UNION
SELECT 'North West', 27, 825, 1.3, 1053 UNION
SELECT 'Yorks and Humb', 22, 545, 1.4, 773 UNION
SELECT 'East Midlands', 31, 750, 1.5, 1111 UNION
SELECT 'West Midlands', 28, 635, 1.3, 803 UNION
SELECT 'East', 21, 585, 1.4, 810 UNION
SELECT 'London', 92, 312, 1.1, 340 UNION
SELECT 'South East', 25, 950, 1.4, 1320 UNION
SELECT 'South West', 28, 674, 1.4, 940 UNION
SELECT 'Wales', 30, 460, 1.4, 647 UNION
SELECT 'Scotland', 23, 547, 1.5, 820 UNION
SELECT 'Northern Ireland', 40, 302, 1.4, 430 UNION
SELECT 'UK', 26, 6604, 1.4, 9000 )
INSERT INTO [fact].Petmetrics
SELECT a.AreaKey, (SELECT PetKey FROM dim.Pet Where PetDescription = 'Wolf') AS PetKey,
d.PopulationwithPetsPerct,d.HouseholdswithPets000s,d.Petsperhousehold,d.Petsperregion000s
FROM CTE_DOGS d
INNER JOIN dim.Area a ON d.AreaDescr = AreaDescription
WITH CTE_CATS (AreaDescr, PopulationwithPetsPerct,HouseholdswithPets000s,Petsperhousehold,Petsperregion000s)
AS
(SELECT 'North East', 14, 195, 1.5, 286 UNION
SELECT 'North West', 16, 520, 1.6, 795 UNION
SELECT 'Yorks and Humb', 19, 443, 1.6, 680 UNION
SELECT 'East Midlands', 20, 480, 1.8, 854 UNION
SELECT 'West Midlands', 17, 400, 1.7, 662 UNION
SELECT 'East', 20, 512, 1.8, 876 UNION
SELECT 'London', 14, 428, 1.5, 580 UNION
SELECT 'South East', 20, 890, 1.8, 1422 UNION
SELECT 'South West', 21, 514, 1.6, 810 UNION
SELECT 'Wales', 22, 360, 1.7, 596 UNION
SELECT 'Scotland', 15, 381, 1.6, 590 UNION
SELECT 'Northern Ireland', 14, 106, 1.5, 160 UNION
SELECT 'UK', 18, 4995, 1.6, 8000)
INSERT INTO [fact].Petmetrics
SELECT a.AreaKey, (SELECT PetKey FROM dim.Pet Where PetDescription = 'Lion') AS PetKey,
d.PopulationwithPetsPerct,d.HouseholdswithPets000s,d.Petsperhousehold,d.Petsperregion000s
FROM CTE_CATS d
INNER JOIN dim.Area a ON d.AreaDescr = AreaDescription
Setting up Power BI Dataflow in service
As per the recommended approach to Power BI at Enterprise level, a dataflow is going to be added to a dev workspace
Next, Create a data flow
And add all your connection details
Select the tables, in this case its my two dimensions and fact table. then click Transform data.
No transformations are required. All the Keys have been changed from int to text in this dataflow.
Save and Close and Refresh. this dataflow has simply been called Pets
Dev Shared Dataset
Now we are going to create the data set over the top of the dataflow. with the Enterprise Approach in mind we are going to create our shared dataset, containing the model and the DAX. other users could then decide to create reports over this shared dataset.
This is an incredibly simple dataset, and obviously, you will be dealing with much more complex data.
Open power BI desktop.
Get Data
Power BI dataflows
Choose the tables and in this case load the data because no transformations are required
Make sure the model is ok
create some basic DAX
Pets Per Household = SUM('fact Petmetrics'[Petsperhousehold])
Households with Pets (000s) = SUM('fact Petmetrics'[HouseholdswithPets000s])
Pets Per region (000s) = SUM('fact Petmetrics'[Petsperregion000s])
% Population with Pets = AVERAGE('fact Petmetrics'[PopulationwithPetsPerct])
And over this a very basic test report is created
Power Query in Power BI. Set dataflow Parameters
Before we move on. Later we will need to copy this and change the dataflows from Dev to prod. An easy way to do this is to set up parameters
In Power BI go to Transform data
And create another parameter for dataflowID
You can then right click on a Query and find these values specific to working with dataflows. Copy and paste the IDs to Workspace and Dataflow Current Value.
If you go into the dataflow in Service, you can also find these details in the URL.
Once your parameters have the correct information. Go into Each Query Advanced Editor and change the query to using the parameter rather than the hardcoded value
Source{[workspaceId=workspaceID]}
{[dataflowId=dataflowID]}
This means that you simply have to do this once, When you Copy to Production, change the IDs in the parameters to change the data source.
Once completed Close and Apply
Publish the Report
This report is now published to the Dev Workspace
The report has been saved as Dev_Pets and Saved to the Dev Pets App Workspace
Now we are in the position where we are in development in Power BI Service.
In this example, we have checked everything in development and we are ready to move on to create the reporting Pbix file.
It is recommended to create all your reports in a separate pbix file and just use the shared data set for testing visuals
Create the reporting Pbix
Open Power BI
Get Data
Power BI Datasets
Connect to Dev_pets
The model and all the DAX is pre prepared. recreate your reports. Imagine in a real life scenario, this would be a much more polished version of your test reports
There is now a Live connection between the power BI Dataset and the reporting Dataset.
Save and Publish the report
And again, save to the Dev workspace
There is a dataflow
A Dataset and a test report over the dataset (dev_Pets)
and a Report (Pet Statistics in the UK) live connected to dev_Pets dataset
We are ready to move to Production
Production Workspace
We now create a Production Workspace
Move Dataflows to Prod
Back in dev workspace, go to the dataflow and click on …
Choose Export Json
It downloads to the Downloads folder.
Open the JSON in Notepad ++
We are looking for each query to update:
Source = Sql.Database
and then the database \”Dev_PET_DB\”)
For this example, only the database needs to change.
You may also wish to change the name of the dataflow in the JSON file
This JSON File can then be saved.
Go back to the Production Workspace
+ New Dataflow
Open the JSON file that has just been amended
This will be imported into power BI
And you will probably need to establish your Production Credentials
And I can immediately see that we are in Production because our cats and dogs have got fiercer.
This will need to happen every time you move to Prod. Export the JSON and update the information about the data within the JSON file.
Power BI Desktop
We have the following pbix files
And a Production Folder has been created. Copy both of these reports and add them into Production
Dev has been renamed to Prod. these can be opened and Published to Prod
Open up Prod_Pets in Power BI desktop
Go to transform data
Now you can simple change the parameters to prod to change the data flow source. You have already set each query to use the parameter in Dev
Where does the production IDs come from?
go back to the power BI Service. Into the Production dataflow and get the URL
Once the dataflow source has been changed, Close and Apply
This would be an easier process if you were connected to your SQL Database. You could simply change the data source. Dataflows make this task much harder to do.
Then Publish to Prod
Open up Prod_Pets from the production Folder in Power BI desktop
This has a live connection to the dataset that was just published. We need to change it from dev to Prod
And change to Prod_Pets
You can then tell your report has changed, in this case my animals have changed.
If your data is the same in production and development it becomes a lot harder to establish that you have done the right thing
Again, Publish your reports
Test your Production Reports
Now its time to test your Reports to make sure they are working ok.
What about Dashboards?
So far, we haven’t covered dashboards in this situation. This is dealt with automatically within the pipeline, but without the pipeline, how difficult is this to deal with?
Create a Dashboard in Dev
back in development workspace, lets pin a couple of visuals to a dashboard
we can do this by using get Quick Insights over the dev_Pets dataset. there is only one insight because the data set is so small but we can pin this to a dashboard
For the target dashboard. create an empty dashboard in Production
Now we have more content in dev, but it looks like without Pipelines, there is no way of moving the dashboard easily.
After reading some of these documents, if you are happy using Powershell or REST APIS these may be ways forward. Otherwise you will have to recreate your dashboards from scratch in Production. Its about weighing up which will be faster for you.
Creating Apps
We have a dev Workspace and a Prod workspace. In this situation I may offer an app in development to the testers. The app in Production is for all the Report users.
With this in mind go back to the Dev workspace
And do the same with the production App from the production workspace. the word Production is removed from the App.
And of course for each of these apps you can set up Navigation and Permissions.
Conclusion
There are multiple issues here outside of Power BI Premium.
Dataflows have already proved difficult to work with outside of the Premium environment and here they cause issues when attaching the production shared data set to the Production dataflows. Imagine having multiple reports and many queries to deal with. there are way to many error points in this process.
There is also an issue with the dashboards at present.
It would seem that this set up may be too much to deal with outside of the Premium environment using Pipelines.
Its possibly one to avoid if you
Have many reports
Have many dashboards containing alerts etc.
Have large data models with many queries in Power Query Editor
Use Dataflows
Aren’t fully familiar with using REST APIS or Powershell for Power BI if you have Dashboards
In this case, the only options are:
Move to Power BI Premium and start using Pipelines (Proviso on Pipelines working with Dataflows)
Simply have one workspace as dev and use your App as Production
Think about Power BI Premium Per User license and move to Pipelines
Understand that if you go this route, the time from dev to Prod may be considerable and there must be extra testing in case there has been anything missed along the way.
It is very easy for Power BI Developers to create and then publish reports to the service without much thought.
It will be different from company to company, but it would be great to remind developers each time they publish that there are certain standards that need to be maintained for each published report
With the December 2020 Update there is now a way for the Power BI Admin to create a message for your report Developers on Publish.
The power BI Admin (or global Administrator) can go into Power BI Admin Portal
As the Admin, lets add a message for our users to make sure they understand the importance of the security on the App workspace.
Should they be using Security groups rather than email addresses?
There are many considerations that you can address here (to 5,000 characters)
This new setting may take about 15 minutes to work and become part of the publish process.
Once set up, every time you publish you will see the disclaimer
This gives your developers a final reminder of all the checks they need to do before publishing.
This is a great new addition to the Admin tenant settings.
Power BI Loves a Star Schema and It loves single direction joins, one to many from your dimension (Description) tables to your central fact (Business metrics) table
The reason for the single direction filter join? You want to be able to filter your measure by descriptors. Sales by Product category. Quantity Sold by Business Unit.
There isnt a need to filter a descriptor by a measure. it cant happen.
This is nice simple logic which works really well. However, there are some use cases where this may not apply. Lets look at our Activities model to get more of an idea of this in action.
Activities Model
The Date table is used in lots of other models and has dates from 1990 to 2035 in it.
This model only has 10 years of data and its important that the latest date for all the DAX and Filters is not the current date but the last date in the data
This model is at year level and the last year in the data set is Currently 2019 (We are now in 2021)
the first thing to do is to test that the flags are working
Year from the date table
Flags from the flag table
And this works fine. There are only flags to 2003 to 2019 so all the years not attached to these are omitted and its all fine.
Then Activities measure from the fact table is added and it all seems to go wrong (Keys have been added to show the issue)
Note that Activities are 0
The Key (dateKey from dim to fact, FlagKey dim to fact) are essentially cross joining. There should only be one year.
If you Filter the Table so Activities are greater than 0 everything is resolved. The Fact is being filtered.
What is happening?
When the measure comes back as 0 or Null, we are not filtering the fact table
So we want to filter year by the flag but there is only a single direction filter to the factor table. Without the filter on the fact table, its almost like there is now a block in the middle, not allowing other filters to work.
You only see this because:
a. You want to see metrics that are null or 0
b. If the flag was in the date table rather than a separate dimension then there wouldn’t be an issue. Because its in another dimension it cant filter the year.
For this specific issue, the joins between date and the fact and the flag dimension and the fact has been changed from Single Direction to cross join.
Now the flag table can filter the year if we aren’t filtering the measure.
Why are cross joins not recommended in power BI?
There is always a performance issue when you do the bi directional join so you should only do this if you have to.
Bi Directional Filters are one of the top Power BI performance Killers because Power BI has to work much harder with that join
Other Ways to Resolve the issue
Resolve in SQL
The Flags are specific to the report date NOT the current date. But, if the Date dimension was created in SQL Pre Power BI, these flags could have been added in the Date table. Then simply imported into Power BI within the Date dimension
Resolve in Power Query Editor in Power BI
With the Date Dimension and the flag dimension still intact in Power BI.
In Power Query Editor, Merge Flags into date,
Add in the Flag for the last 10 years into the date table.
Then Filter the date table so there is only 10 years worth of dates.
This would ensure you didn’t need to cross filter join so long as the criteria is that you want to see 10 years of data
One of the main benefits of Power BI Premium is the ability to share with hundreds of users who don’t all have to have their own Power BI Pro license at £7.50 a month.
At a certain level, Premium becomes less costly than giving everyone who needs them Pro licenses. its said, you need 500 or more users for Premium to make sense.
However, its not just about having the ability to have hundreds of people viewing your reports. There are many more reasons to have Premium. There are lots of enterprise style features not part of Pro. Enterprise of course comes with the ability to have larger and speedier models.
This is a real issue for smaller businesses who cant take advantage of Premium per capacity, P1 P2 or P3 nodes.
However, there now may be an option to have premium capabilities without having a Premium License.
Premium per user is targeted at small and medium businesses because, if you are not a large enterprise, the Premium price point of just under £4K every month can be eye watering.
Premium extends Power BIs licensing model
Lets have a look at some features between Pro, Premium Per User and Premium
Model Size
Power BI Pro 1 gig per data set. Workspace Max 10 BG
Premium Per user 10gig (Per model)
Premium Per Capacity 10 gig (Per model. can be refreshed up to 12)
Refresh Rate
Power BI Pro 8 refreshes a day
Premium Per user 48 refreshes a day
Premium Per Capacity 48 refreshes a day (Gen 2 has significantly improved refreshes)
Paginated reporting
Paginated Reporting comes with Report Builder. the free tool for creating Paginated Reports. You can build paginated reports over a model created with power BI, or other data sources and publish to a Power BI workspace in the same way as a Power BI Report
Use a paginated report if you want to do printing or PDF generation. they are great for Sales invoices for example. Power BI reports are used for exploring the data.
Power BI Pro Can use Report Builder Free but cant publish to a Pro workspace
Premium Per user Yes
Premium Per Capacity Yes
AI Capabilities
Apply ML Model in dataflows
Impact Analysis in Service
AI Insights in Power Query Editor and Dataflows
Power BI Pro No
Premium Per user Yes
Premium Per Capacity Yes
Advanced Dataflows
For example, direct query and the ability to create compute and liked entities (actions that perform in storage computations)
Power BI Pro No
Premium Per user Yes
Premium Per Capacity Yes
Usage based Aggregate Optimisation
Aggregations allow you to manage large tables. You can have tables at a higher level of granularity, aggregated within Power BI, for example at year level, which are imported into Power BI. When you want to drill down to lower level detail, you can then move to the detailed data in Direct Query mode. aggregations should generally only be used for really large models.
Power BI Pro Yes?
Premium Per user Yes
Premium Per Capacity Yes
Deployment Pipelines for Application Lifecycle Management
Power BI Pro No
Premium Per user Yes
Premium Per Capacity Yes
XMLA Endpoint Connectivity
XML For analysis protocol. XMLA is used to connect to the Analysis Services engine which allows Power BI to have all the features of Analysis Services.
A major draw for this feature is the ability to create your shared one view of the truth data model within Power BI. And allow that model to be used by other analytics services, not just Power BI
Power BI Pro No
Premium Per user Yes
Premium Per Capacity Yes
Enhanced Automatic Page Refresh
Available as settings within the Power BI Admin Portal.
Power BI Pro No
Premium Per user Yes
Premium Per Capacity Yes
Multi Geo Support
Helps multinational customers deploy to data centres around the world, rather than just the home data centre.
Power BI Pro No
Premium Per user No
Premium Per Capacity Yes
Unlimited Distribution
This is the big one for Power BI Premium. the ability so share content with many users without individual Pro licenses. We will look more into this later
Power BI Pro No
Premium Per user No
Premium Per Capacity Yes
Power BI Reports On Premises
Using the Power BI reports Server. This option gears up an enterprise for moving fully to the Power BI Premium service later.
Updates to the specific Power BI Desktop (for on premesis usage) are much slower that Power BI Desktop for Service. You get reduced functionality. For example, no dashboards.
Power BI Pro No
Premium Per user No
Premium Per Capacity Yes
Bring your Own Key
Power BI encrypts data at rest and in process and uses Microsoft managed keys to do so. Premium allows you to use your own keys which sometimes makes it easier to meet compliance requirements. It gives you extra control.
Power BI Pro No
Premium Per user No
Premium Per Capacity Yes
Getting Premium Per user?
Upgrade to Power BI Pro and then upgrade to a Premium per user license
This will extend until general availability
Do we know what the Price point is yet? No. At the moment its free but without the knowledge of the actual pricing this is a hard one to take up before general release
Premium per user overwrites the Power BI Pro user license so there is no need for both
The Power BI Premium per user Workspace
You need to create your workspace. then go to settings and assign Premium per user capacity afterwards.
Only other developers with a premium per user license will be able to access the workspace.
This is a major point. If you are a team of 4 working in one workspace. Each user needs the Premium per user licence. So none of your developers with Pro licenses can work within this workspace.
None of your report users can access the report via the app without having Power BI Premium Per Users either.
Without that price its incredibly difficult right now to look into how this will affect the business as a whole. essentially it would mean switching everyone up to Power BI Premium Per user Licenses
Do we know if Premium Per user will be bundled into the Office 365 E5 Offering?
Currently if you have E5 licenses Power BI comes with the package. With Premium per user, will this become part of the E5 package?
It looks like E5 customers can purchase Premium per user as an add on to Pro but again, there is no specific information on this as yet so its difficult to tell how this will effect things.
So, as usual there are lots and pros and cons to this new license and we need a lot more information on pricing to be able to make any decisions.
But the ability to use features that are tempting you across to Premium, that’s really interesting. I thought that maybe there would be a case for going through your reporting portfolio to see if you have a mixture of cases for Pro and Premium per license but what with Dataflows, Pipelines etc, it would be difficult to establish a split between the workloads.
Currently Premium Gen 2 is in Preview (Jan 20201) but it looks really exciting for those with Premium capacity. Lets have a look at Gen 2 and see how it differs to Gen 1
Gen 1
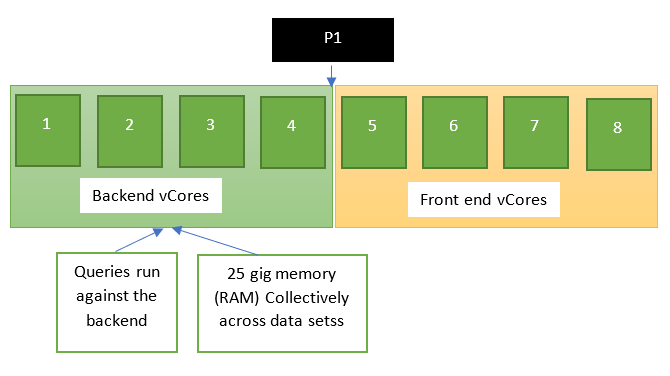
With Premium Gen 1 we are bound by the number of vCores and by the memory we have. Lets take the P1 SKU as an example
P1, P2 P3 P4 = Are all Premium SKUs. Each one has more vCores for better performance
SKU = Stock Keeping Unit
vCores = Virtual Cores is a puchasing model which gives you more control over compute and memory requirements.
When it comes to Premium, reports would slow down if there were two many queries running. And if people were using many models at the same time you would have to wait for your time slot.
As you can see, there is only 25 gig memory across the data sets Once a report isn’t being run and used any more, that memory gets dropped and is added back into the pool.
Report users and report developers are also fighting with report refreshes.
Premium Gen 2
Gen 2 is not in generally availability yet but if you have Premium you can switch to Gen 2 in preview.
In Power BI Admin (as the Power BI administrator or Global Admin)
Go to the Capacity Settings and switch Gen 2 from disabled to enabled.
You can also go back to Gen 1 if you need to but if you do make sure you flag up any issues you are having.
lets have a look at the model compared to Gen 1
Autoscaling
The end users encounter the throttling and performance issues with Gen1 because they physically only have 4 backend vCores. Now with Gen2, Autoscaling allows you to deal with spikes. This is not available yet but will be coming. This is helped by the fact that there are other vCores that can be called on.
If you do come up to the 4 core Limitation it will, or may lend you a vCore so you don’t see impact for your end users
Previously our admins had to deal with this kind of problem but this will really help automate these kind of issues
Memory
Data Sets can go over the 25 gig memory capacity. Previously Premium was 25 gig for all the data sets. Now Data sets are gated individually.
This is a fantastic update. We don’t have to worry about the collective size of all our data sets.
Refreshes
Previously there was a maximum of 6 refreshes at any one time. Otherwise you can get throttled.
With Gen 2, refreshes get spread out over a 24 hour period and don’t impact other queries from users. refreshes just run
The looks great. People are seeing refreshes of an hour and a half coming down to 10 minutes.
Capacity Usage Metrics
This is coming soon and will have a breakdown of items.
Its a little annoying when you have set up gen 2 and want to view the metrics to see how everything is working but currently can’t.
With Gen 2 we will also be able to work against a chargeback model. This means that we can spread the costs of Premium between distinct areas of an organisation dependant upon their usage.
Workloads
Again the workload settings aren’t fully functional at the moment but more will be coming.
For example for data set workloads we can specify minimun refresh intervals and execution intervals. we can detect changes in our metrics.
We don’t have settings for dataflows and AI yet.
Why go with Premium Gen 2 Checklist
Performance benefits
End users see faster reports
Refreshes, we now don’t have refresh bottlenecks and we remove refresh failures due to throttling
Premium per user
Improved metrics will be introduced soon
Autoscaling
Proactive admin notifications
Why it may be worth waiting until Preview becomes GA
It looks like people are having some issues with dataflows and there is already be a known issue about this
It looks like this might be fixed quickly, and once dataflows are OK, it seems like. A workaround is to move your dataflows out into another Workspace and then back in but hopefully this will get much better.
Questions
Is Premium Gen 2 going to be the same price as Gen 1?
Is there any way to find out how many dataflows you have if dataflows are an issue?
Will we still give great functionality to the Power BI Pro users?