
The Semantic Model
moving straight on from Part 8. We were in the SQL Analytics Endpoint.

At the bottom of the screen we have a model view. This is the Default Model view

This takes us to the Semantic Model
Semantic Modelling in Fabric
Lets update the default semantic model. Set the relationships. Hide Keys, set up Orders, hierarchies etc.
Direct lake
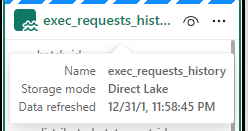
Notice the Storage model is Direct Lake. this has greatly reduced the amount of copies of the data we have. Power BI is using the PARQUET files in the same way it would Import into the Columnar Power BI data Store.
Direct lake is only available with Microsoft Fabric and Delta PARQUET tables
Unfortunately I have hit a problem.
The Semantic Model isn’t working. After every change we hit

‘We cannot access source column ‘<ccon>series</ccon>’ from delta table ‘<ccon>dimepisode</ccon>
However, checking the Data and series is available.
Also the directions on the join are incorrect (Before the changes are removed)
After looking at some of these issues online, it would appear that currently the ‘default’ semantic model is very glitchy and many people are having issues with it.
People are using work arounds by creating their own semantic models rather than using the default. This seems very disappointing, and I hope its rectified soon (As at 30/05/2024)
https://powerbi.microsoft.com/en-gb/blog/improvements-for-creating-new-direct-lake-semantic-models/
Create a Semantic Model
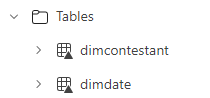
Back in the Lakehouse


Choose New Semantic Model

Select All
Join Dim Episode to Episode Key
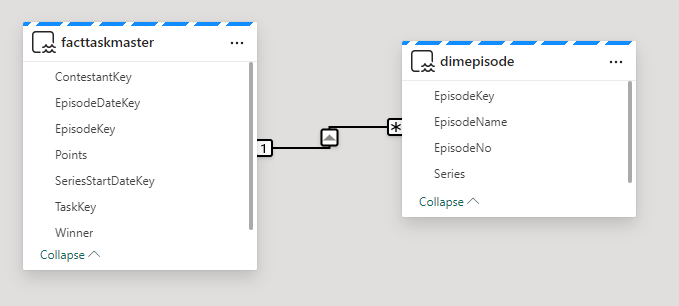
Immediately we see an issue. the many should be on the fact side.
Time to go back to the SQL analytics endpoint to quickly check what is happening.
Going back to My Queries and the Taskmaster data checks file.
SELECT f.TaskKey AS FactTaskKey, COUNT(*)
FROM [DebbiesFabricLakehouse].[dbo].[facttaskmaster] f
GROUP BY f.TaskKey

SELECT t.TaskKey AS DimTaskKey, COUNT(*)
FROM [DebbiesFabricLakehouse].[dbo].[dimtask] t
GROUP BY t.TaskKey
Having COUNT(*) > 1

SELECT Task, TaskOrder, COUNT(*) FROM [DebbiesFabricLakehouse].[dbo].[dimtask]
GROUP BY Task, TaskOrder
HAVING COUNT(*) > 1
it would seem that from running the above queries. Everything is correct. 1 Task to Many. In Power BI desktop this would automatically create the correct relationship for you,
So in this instance, go into the relationship and reset. (is this an issue in Fabric at the moment?)
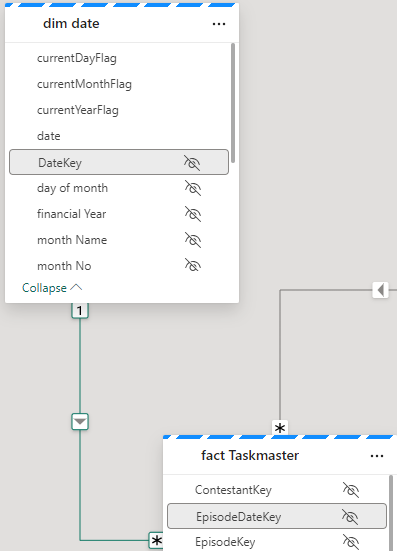
Relationships and hiding keys

Friendly Names
Now I want to set up Friendly names for the columns and tables. If we change a table name in Data, how does this affect the DELTA PARQUET table? Lets check.

it doesn’t affect Delta PARQUET file so lets add Friendly names into the model for the dims
E.g.

Add Sort orders and hide
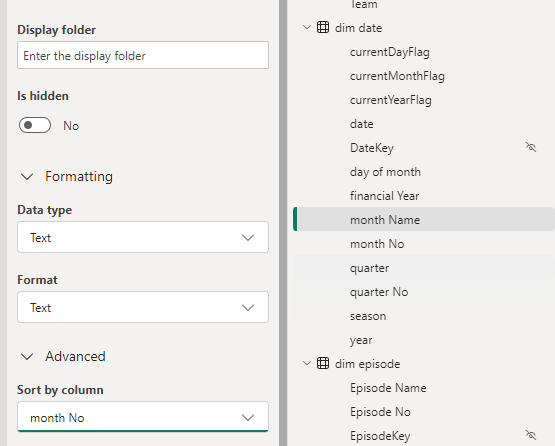
This has been repeated on :
- Dim Date Quarter / Quarter No
- Dim Episode Episode Name / Episode No
- Dim Task Task / Task Order
Hierarchies
Dim Date
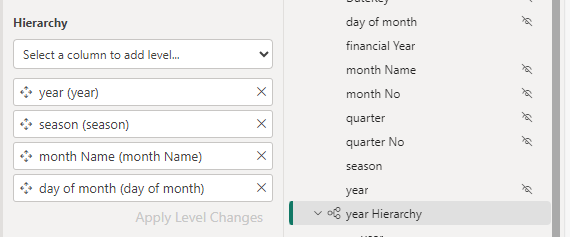
Hide the original fields outside of the hierarchy so not to confuse the user.
For this project, Lets not use Quarter and hide it for the time being
Lets also hide financial year
Dim episode


Don’t forget to click Apply level changes
DAX
Now we can start to add the DAX. The question here is, In power BI Desktop we can create DAX and then immediately create a visual to check its looking good. how do we do this in the Semantic model in Fabric?
Points
Total Points = SUM(‘fact Taskmaster'[Points])
And hide the base metric

And add the new DAX to a Folder


So how do we quickly check this

Using the new report we can quickly create a test report.

No need to save this report. it is just a tester.

There is something wrong with the Date connection. We can go back to the SQL analytics Endpoint to quickly check (After checking the relationships)
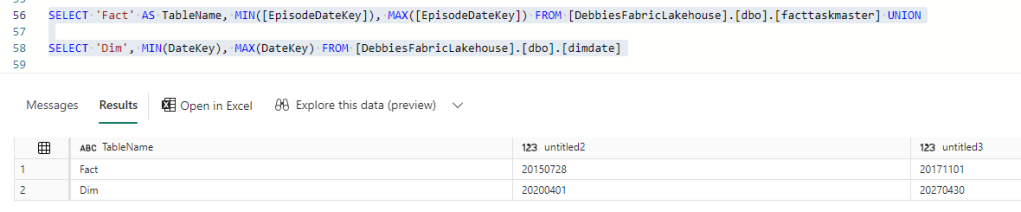
Our Date Dimension starts in 2020, and we are only at 2017 so the Date Delta PARQUET needs an update.
Dim Date NoteBook
Back in Dim Date. All we need to do here is to reconfigure these Start and End Dates

# Define your start and end dates
start_date = '2015-01-01'
end_date = '2027-12-21'
And rerun the entire notebook
then go back to the Query just jun.

And after a refresh on the report

Great. this issue has now been resolved.
Week
And whilst in Dim Date Dimension. there is one thing that we havent added and thats week.
Week is really important because each Each episode is once a week. Its more important than day. So lets quickly update to bring in a Week column and we can update the hierarchy and hide day.
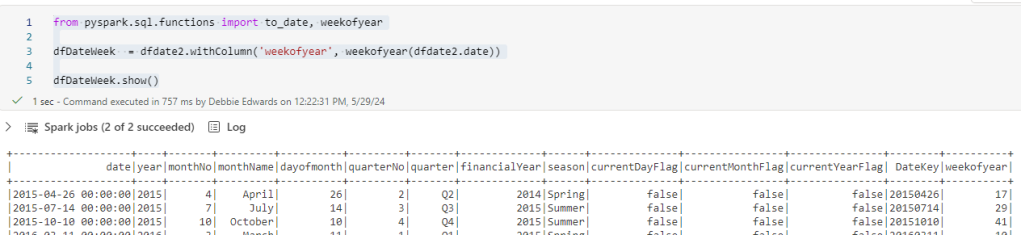
from pyspark.sql.functions import to_date, weekofyear

dfDateWeek  = dfdate2.withColumn('weekofyear', weekofyear(dfdate2.date))

dfDateWeek.show()
And Update the Creation of the files to use this dataframe

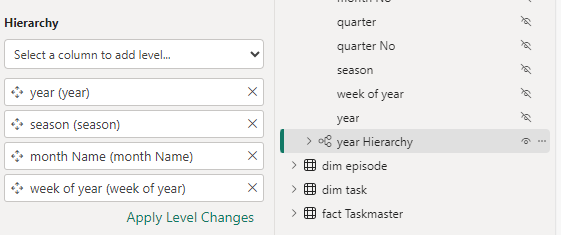
Update the date Hierarchy
Once set lets go back to the semantic model

Right click and Refresh
This didn’t work. Week of year isn’t appearing in the model.
Clicking this seems to have worked.

We don’t want to sum up the weeks so in Properties / Advanced, set summarize by to None.
Update the hierarchy
Also, Don’t forget to set as Date table


Back to the DAX.
Base Metrics
Total Contestants = DISTINCTCOUNT('dim contestant'[Contestant Name])

Total Episodes = DISTINCTCOUNT('fact Taskmaster'[EpisodeKey])

Total Points = SUM('fact Taskmaster'[Points])

Max Points Scored (ALL Contestant Images) = MAXX(
                    ALL( 'dim contestant'[Image]),[Total Points])

Points for Group Tasks = CALCULATE(SUM('fact Taskmaster'[Points]),'dim   task'[Assignment] = "Group")

Points for Special Tasks = CALCULATE(SUM('fact Taskmaster'[Points]),'dim task'[Assignment] = "Special")

Total Series = CALCULATE(DISTINCTCOUNT('dim episode'[Series]), 'dim episode'[Series] <> "NA")

Total Tasks = DISTINCTCOUNT('fact Taskmaster'[TaskKey])

DAX with variables
Winner + Tiebreaker =
var tiewin = CALCULATE(SUM('fact Taskmaster'[Winner]),FILTER('dim task','dim task'[Task Type] = "Tie Breaker"))
RETURN [Total Points]+tiewinDAX using If
Group Tasks = IF(CALCULATE(DISTINCTCOUNT('fact Taskmaster'[SeriesStartDateKey]),'dim task'[Assignment] = "Group") = BLANK(), 0,
              CALCULATE(DISTINCTCOUNT('fact Taskmaster'[TaskKey]),'dim task'[Assignment] = "Group"))

Special Tasks = IF(CALCULATE(DISTINCTCOUNT('fact Taskmaster'[SeriesStartDateKey]),'dim task'[Assignment] = "Special") = BLANK(), 0,              CALCULATE(DISTINCTCOUNT('fact Taskmaster'[TaskKey]),'dim task'[Assignment] = "Special"))

Tie Breaker = IF( CALCULATE(DISTINCTCOUNT('fact Taskmaster'[TaskKey]),'Dim Task'[Task Type] = "Tie Breaker") = BLANK(), 0,              CALCULATE(DISTINCTCOUNT('fact Taskmaster'[TaskKey]),'Dim Task'[Task  Type] = "Tie Breaker"))

Tie Breaker episode ? = IF([Tie Breaker]>=1 , "Tie Breaker", "Won on points")
Percentages
% Tasks = [Total Tasks]/ CALCULATE([Total Tasks], ALL('dim task'[Assignment]))*100

% Tasks by Series = [Total Tasks]/ CALCULATE([Total Tasks], ALL('dim episode'[Series]))*100

% Tasks by Type = [Total Tasks]/ CALCULATE([Total Tasks], ALL('dim task'[Task Type]))*100
And each one is added to a display folder. E.g. Measures\Tie Breaker to give us a sub folder under Measures

Highlighting Metrics By Colour will be used later in the reporting.
Highlight Max Points Scored (ALL Contestant Images) =
Var MaxPoints = MAXX(
                    ALL( 'dim contestant'[Image]),[Total Points])


Var Check = IF([Total Points] = MaxPoints, "Light Green","White")

Return Check

Highlight Max Points Scored (ALL Episodes) =
Var MaxPoints = MAXX(
                    ALL('dim episode'[Episode Name]),[Total Points])


Var Check = IF([Total Points] = MaxPoints, "Light Green","White")

Return Check

Highlight Max Points Scored By Episode =
Var MaxPoints = MAXX(
                    ALL('dim episode'[Episode Name]), [Total Points])


Var Check = IF([Total Points] = MaxPoints, "Light Green","White")

Return Check

Highlight Min Points Scored (ALL Contestant Images) =
Var MaxPoints = MINX(
                    ALL('dim contestant'[Image]), [Total Points])


Var Check = IF([Total Points] = MaxPoints, "Light Red","White")

Return Check
Hide original fact data
With Everything hidden in the table. we get out fact icon, establishing that this is a fact table

Final Updates
Have Thousands separators set for numbers (Measures)

Make sure percentages are also set correctly


Set Image as Image URL in Properties > Advanced
Our Semantic model is complete. Or at least ready for us to start creating reports.
The other thing to note about this semantic model is there is no need to publish. It autosaves and we simply need to refresh our data source for the reporting to bring through changes.
Lets move on to creating the visuals in the next post.
