You can show and hide visuals on a report by using bookmarks buttons and toggles.
Grouping your toggle buttons can simplify your Selections. This example shows how it works with a quick demo
What you need
Two images for on and off (For the toggle bar) I have used the following visuals

I have saved both these visuals to use later
You also need a data set in Power BI just to create this report. I created the following table within the Power BI Report (Enter Data)

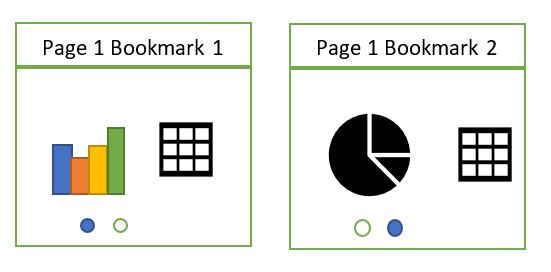
Next, We simply need 3 visuals that we can place on top of each other to show and hide dependent upon the selected bookmark

Time to create the 3 bookmarks. Go to View and select Bookmark pane and Selection Pane


Lets just start to set up the report before we change how the bookmarks work. First of all, Place the visuals on top of one another ready to show and hide. Pie will be our initial start up bookmark.

And now we need the initial toggles to show the pie on and funnel and map off. From Home Click Image and add in the visuals for On Off and Off. You can also add Text for each option (Pie Funnel and Map)

At this point it makes sense to change the name of the images in the Selection pane so you know what each image is for. Also feel free to move the selection order around for it to make sense with what is on the page

Each toggle can either be on or off. Add 3 more visuals, Off On and On and slide them under the toggle images you already have (And rename in reorder in the selection pane.)

Now its time to show and hide the visuals dependent upon the selected bookmark. However, you now have 6 toggles to look after for every single bookmark which is increasing complexity. Each toggle needs to be shown and hidden depending upon the bookmark.
Grouping should hopefully make things a lot easier. First of all set the bookmarks for funnel and map to not update data. We are updating data in the Pie Bookmark

Lets hide the visuals for each bookmark first. In selection pane hide the visual and then Click on the bookmark and update (Don’t forget to update the bookmark after you have hidden visuals)


And now its time for the toggles. We now want to group the images for on and off.
Select all the off images within the selection pane and then click on the visual (As they have already been selected and click Group)

Rename Group 1 ‘Toggles off’. Do the same with the on images and rename to Toggles on. Each group has the toggles within

And now we can show / hide the buttons within each bookmark separately and then update each bookmark.


As you can see, for each bookmark, the corresponding on button is shown and off button hidden. The other two off visuals shown
How its time to set actions on the buttons to go to the correct bookmark
If a visual is shown in the Group you can set the Action under format. It is the off buttons that provide the action to the other bookmarks. For example Pie is on, meaning we are on that bookmark and we can travel to either funnel or map.
Again, click on the bookmark, set the actions for the off images and then update the bookmarks before moving onto the next

When you go to Funnel Bookmark, you will need to set the Off pie visual because it hasn’t been done yet but map already has the action set from the previous bookmark and you always want to go to Map from this image.
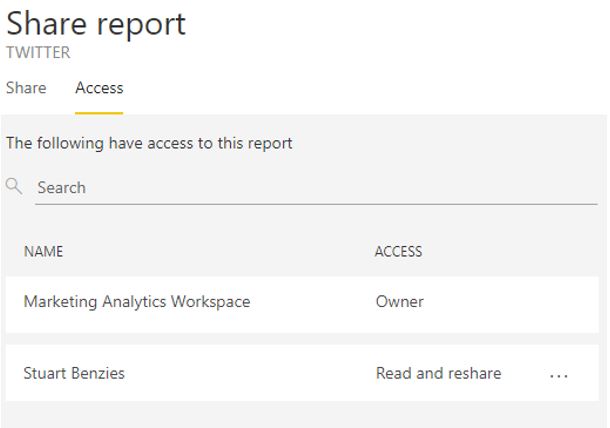
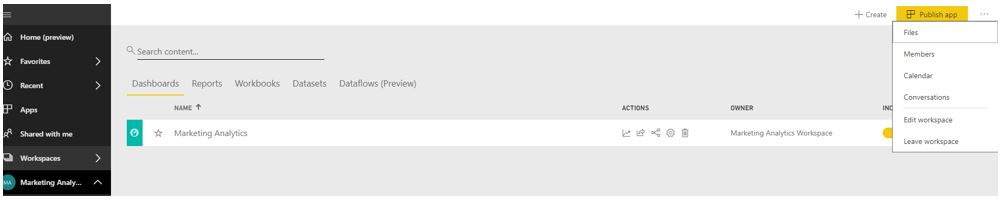
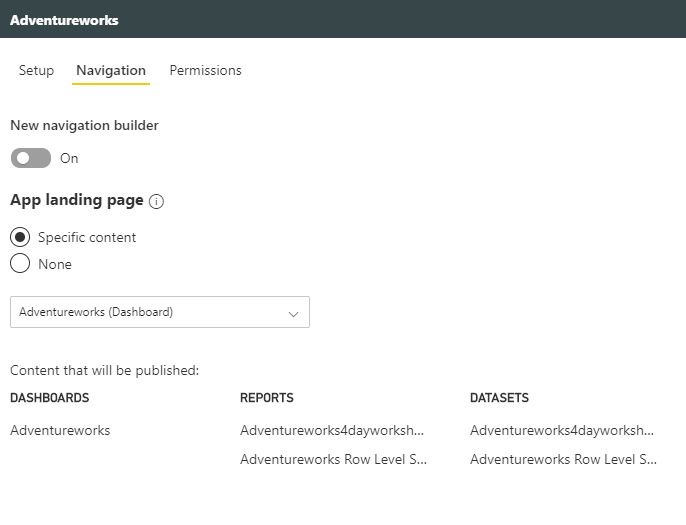
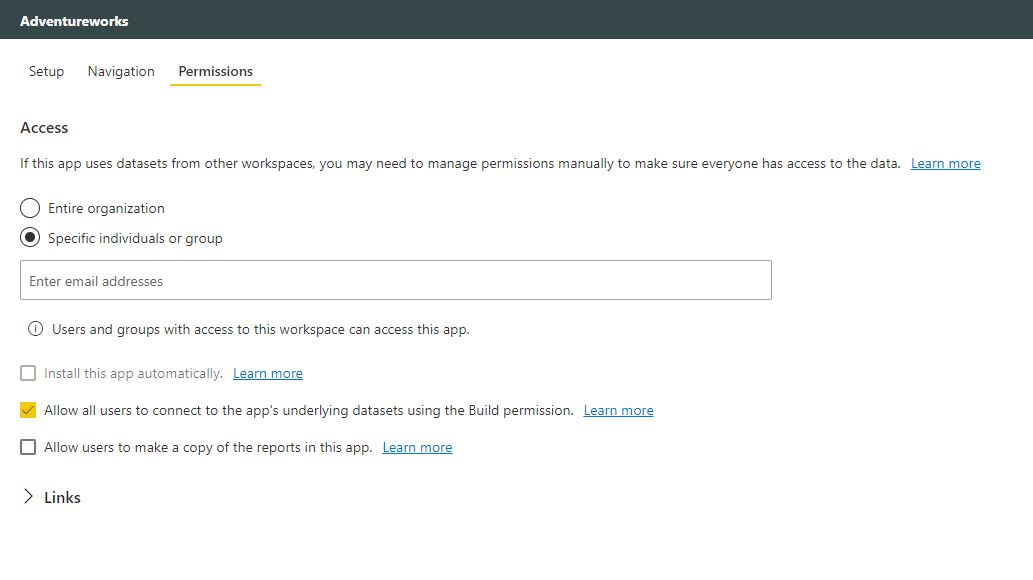
When you get to funnel all the actions for the off buttons have been created. This is a much easier way of looking after your toggles to show and hide visuals. Time to Publish your new report to check that its working in the expected way. For this report I am simply publishing to My Workspace.


If you check how to create the same functionality without grouping your buttons first, you can see that its much more complex. This is a great update and will make things so much easier in future.
See https://debbiesmspowerbiazureblog.home.blog/2019/08/07/power-bi-bookmarks-buttons-and-toggles/ for the original how to solution
Later I will look at how you can use groupings to create pages without multiple panels.