After 14 years using Microsoft On Premise BI Tools (SQL Server, Reporting Services, Integration Services and Analysis Services) Its time to embrace Business Intelligence in the cloud.
Before continuing on with this project, lets look at an amendment to the lake house structure. mostly because we decided we wanted to keep the structure of the Task Flow. Instead of having one Lakehouse for Gold Silver and Bronze. We want three lake houses. One each for Bronze Silver and Gold.
3 new lakehouses are created
And now, the Notebooks need updating
Taskmaster Transformed
In the notebook.
Bronze is the main lakehouse that we are pulling the data from. But you can also add another Lakehouse.
And use the arrows to switch between the two.
The only Code that needs to be changed is when we create the Silver PARQET file (Its not Delta PARQUET at this point.
From
To
To get the ABFS path to move from Default Data Lake to another Delta Lake, right click on the destination lake and Copy ABFS Path
And we can go further, by parameterising the workspace ID and the lakehouse ID
f has been added to allow us to add parameters into the location string.
So we can now use this when we want to create a PARQET file in a different Lakehouse to the default one.
And we have introduced parameters.
Now we want to know how to do with with a Delta Parquet file moving it into the Gold Lakehouse
Silver to Gold lakehouse Delta Parquet
To
from delta.tables import DeltaTable


#You can also add the none default data lake by clicking +Lakehouse
aliased_df.write.mode("overwrite").option("overwriteSchema", "true").format("delta").saveAsTable("GoldDebbiesTraininglh.dimContestant")
And again, we clicked + and Added the Gold Lakehouse as the none default.
How can you tell which is the default?
Hover over the Lakehouse Name to get the list.
Conclusion
We have now transformed the architecture of the Lakehouse to have three Lakehouses. gold. Silver and Bronze. instead of One Lakehouse with 3 folders for Gold Silver and Bronze,
This has allowed us to see how the code changes when creating files in none default Lakehouses. And has allowed us to set up our first parameters. and it also means we can use the medallion task flow as is without having to do any amendments.
It also feels right to have more separation of the three areas.
In Part 11 we created Power BI reporting and changed the usual PBIX to a PBIP Project file.
Before moving on, lets have a quick look at a new feature in Fabric. Task Flows
Back in the Fabric Workspace
We can now build a task flow. But what is it?
Its a new workspace feature to visualise the collection of processes for an end to end solution.
There are specific types of tasks that we will look at later
There are two ways of going about this.
You have started a brand new project and you have your initial Task flow set up to start adding in tasks. This helps you work with your architecture,
You have already created tasks (Like this project) and want to assign them to a task flow.
Lets begin
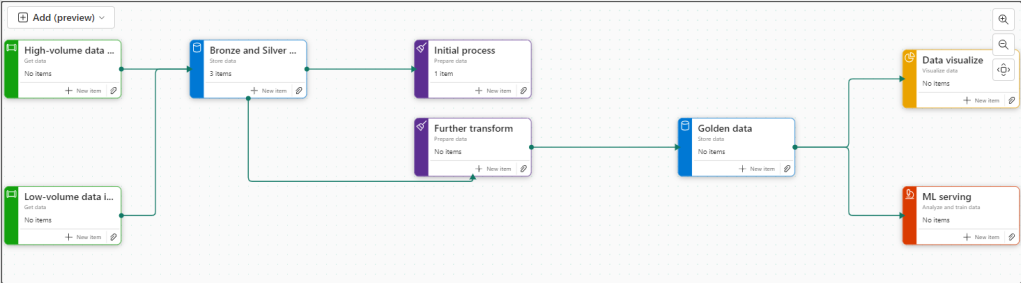
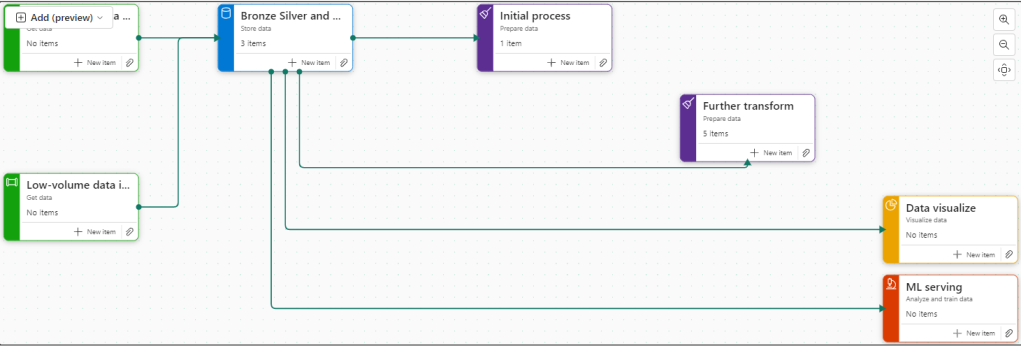
There are 8 flows available at the moment. Throughout the Fabric journey, the medallion architecture has been championed so lets go with this.
Colouring
Green Items are Get data
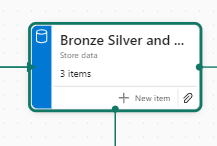
Blue Items are Store Data
Purple items are Prepare data
Yellow items are Visualise data
Red Items are Analyse and train Data
Creating new Tasks
If you haven’t yet started. When you set up your board. you need to assign items to each task.
There are no Data Engineering steps in this development project for getting data so lets start with the green tasks.
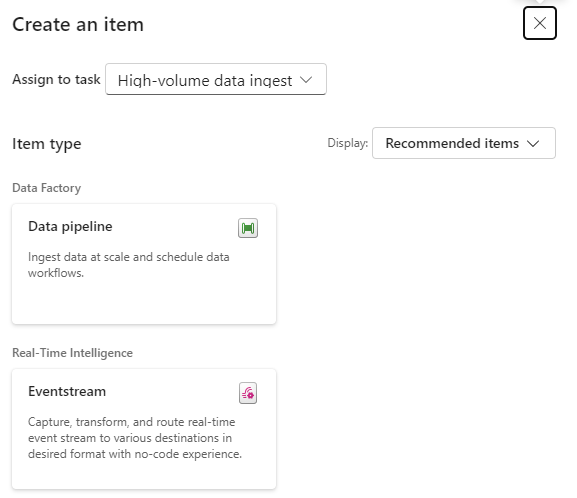
Click New Item
And we get options of what to create for Low Volume data. Great. We have recommended items (which we can change to all) So if you wanted to go Low code a Data Factory Dataflow Gen2 might be the way to go.
lets have a look at high volume data
Here, a Data Pipeline would probably be used for this project.
Data Factory was previously the go to for copying files across into the Data lake so as the data engineer, I would possibly pick pipelines for both types of data processing.
Already this is a great way of working. We know we need to do all these processes but the amount of possibilities can be bewildering. So let Fabric give you recommendations every step of the way.
Assigning Items to a Task
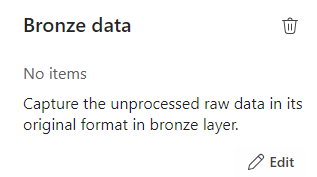
Bronze Data
If we quickly click new item to check the recommendations
We have already set up a Lakehouse for Taskmaster.
Click the little paper clip icon to attach a task
And Select the Lakehouse
Now we have 3 items at Bronze Data Level
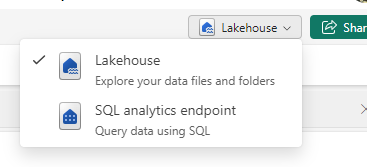
DebbiesFabricLakehouse Top Level
The SQL Analytics Endpoint
The semantic Model (default) This wasn’t used because there were issues with errors occurring whilst developing.
Selecting the Bronze data Task shows you the objects in that task.
Lets move on to
Initial process
We have a Data Engineering notebook set up that Creates our initial transformed Silver layer. This can be added here
One current real issue for me is the vertical bar on Fabric and Power BI
You have to go to the end to scroll down. And you can’t see your items. Extremely annoying when working on smaller screens. This is actually a large screen but you cant make the box any bigger. You have to manually make the columns smaller each time .
I hope they sort this out soon
What happens when you accidentally assign an item to the wrong task flow
I have added the Lake house to the initial Process accidentally.
Hover over the tasks and select the ones you want to remove
And Unassign from all Tasks which appears
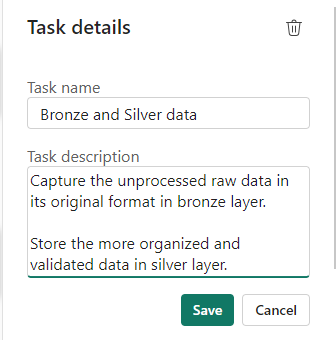
Silver Data
In this case the Lakehouse contains bronze and silver layer, so this is for both.
What happens when we assign the lakehouse to silver?
Well, you can’t do this. An item can only be for a single task. So how do we relate this to our medallion architecture above?
For the time being, go to Bronze Data and edit
Assign the Lakehouse
Click on Silver Data
Delete. We don’t need this
This leaves a gap in our flow
Connecting Tasks
Click the edge of the starting task and join to the end task
Further transformation
We have Notebooks that prep the dims and facts. Lets add them
Golden Data
Another Data Store and again our golden data is in Delta Parquet in the Lakehouse. Looks like we can edit the initial Store data again
Mini gripe. You can’t see all of the information so you cant tell its bronze silver and gold.
Delete Golden Data
Personally I would prefer to have all three on the pane and share the Data lake between all three tasks.
But where do we add the semantic model?
The Semantic model comes before visualising the data. But we have nowhere for this.
Creating paginated reports and semantic models from a task isn’t supported.
Well this is a real shame. it feels like this needs to be added before its a really usable solution.
Data Visualise
Our report is in a PBIX File.
We don’t have any Dashboards
Lets publish the Content from Pbix to the Fabric Workspace.
Then go back to the workspace
Interestingly these are now uncommitted items and show up in source control.
In Part 10 we did a lot of work getting the PBIX file into source control. What will this do? we will look at this later.
Back to Data Visualize
We add the reporting
The Semantic Model has also been added here, Hopefully a new task will be added soon specifically for the semantic model, there are currently no items types for semantic modelling.
There is no ML Service so we could get rid of this task.
Old Notebooks not being used (Filters).
There are a few Notebooks from the old version not part of this, can we see them?
Another issue. Selecting Not Specific for Task doesn’t filter the Tasks without a Task Specified. Something else that needs to be ironed out.
Conclusion.
There are currently a fair few issues with this but it is new and hopefully they will get ironed out.
I still don’t like scrolling in any of the Power BI / Fabric Service solutions because it doesn’t automatically resize to page size. This has been an annoyance for a long time now. I really wish it would get sorted.
Semantic modelling needs to be added. Filtering needs to be much better,
And I genuinely wish you could have an item in multiple tasks, especially store data. But overall I really love this feature and can’t wait to see if get some more development
Only the Delta table are available with the SQL endpoint.
Lets try some options
New SQL Query
We can use SQL to check that we are happy with what has been created
SELECT e.Series, e.EpisodeName,t.Task, t.TaskType, c.ContestantName, f.Points
FROM [DebbiesFabricLakehouse].[dbo].[facttaskmaster] f
inner join [DebbiesFabricLakehouse].[dbo].[dimepisode] e on f.EpisodeKey = e.EpisodeKey
inner join [DebbiesFabricLakehouse].[dbo].[dimtask] t on t.TaskKey = f.TaskKey
inner join [DebbiesFabricLakehouse].[dbo].[dimcontestant] c ON c.ContestantKey = f.ContestantKey
Where e.EpisodeName = 'The poet and the egg'
Order by t.Task
Immediately we can spot some problems.
Task 1 has 10 records and not 5. there should always be 5.
We can write a query to see how many issues there are

With CTEtm (Series, EpisodeName,Task, TaskType, ContestantName, Points)

AS
(SELECT e.Series, e.EpisodeName,t.Task, t.TaskType, c.ContestantName, f.Points
FROM [DebbiesFabricLakehouse].[dbo].[facttaskmaster] f
inner join [DebbiesFabricLakehouse].[dbo].[dimepisode] e on f.EpisodeKey = e.EpisodeKey
inner join [DebbiesFabricLakehouse].[dbo].[dimtask] t on t.TaskKey = f.TaskKey
inner join [DebbiesFabricLakehouse].[dbo].[dimcontestant] c ON c.ContestantKey = f.ContestantKey)

SELECT Series, EpisodeName, Task, count(*) AS TotalRows
FROM CTEtm
GROUP BY Series, EpisodeName, Task
Having COUNT(*)>5
There are 146 issues.
You cant manipulate the data with UPDATE’s inserts etc.
New Visual Query
lets try and get an issue example using a visual query
Before merging with the contestant, the contestant needed to be dragged into the analytics pane.
This is very similar to the power Query Editor and could be of use to people who aren’t as proficient in SQL and prefer using visual tools
Personally I prefer SQL. So I will stick to this.
Back in SQL Query
SELECT e.Series, e.EpisodeName,t.Task, t.TaskType, c.ContestantName, f.Points
FROM [DebbiesFabricLakehouse].[dbo].[facttaskmaster] f
inner join [DebbiesFabricLakehouse].[dbo].[dimepisode] e on f.EpisodeKey = e.EpisodeKey
inner join [DebbiesFabricLakehouse].[dbo].[dimtask] t on t.TaskKey = f.TaskKey
inner join [DebbiesFabricLakehouse].[dbo].[dimcontestant] c ON c.ContestantKey = f.ContestantKey
Where e.Series = 'S1'
AND t.Task = 'Buy a gift for the Taskmaster'
Order by c.ContestantName
Clearly we have an issue with Dim Contestant. We have two of every contestant. This has been super useful. We cant resolve in SQL so its time to go back to the contestant notebook.
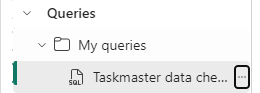
The SQL code is going to be kept here in Queries
You can also moved to Shared Queries to other developers can access your queries.
Back in the Contestants V2 Notebook
We have an issue in the Contestants Dim.
After we drop the records where Team is null we now need to add additional Pyspark to check for Duplicates
from pyspark.sql.functions import min, substring

# Group by "Contestant" and aggregate the minimum "Episode Date"
dfContfinalGrp = dfContfinal.groupBy("Contestant Name").count()
dfContfinalGrp = dfContfinalGrp.filter(col("count") > 1)

# Show the resulting DataFrame
dfContfinalGrp.show()
These will cause issues. Why is it happening?
filter_column = dfContfinal.filter(col("Contestant Name") == "Noel Fielding")

# Show the resulting DataFrame
filter_column.show()
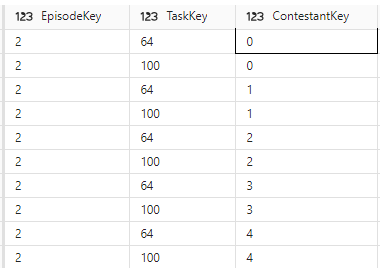
Its seat causing the issues because these contestants have been on Taskmaster more than once.
This causes us an issue. This is fine, Because the granularity is the contestant and seat. We need to update the Fact table key accordingly. And it goes even further than this. What we really need to do is go back to the original transformation notebook to ensure we can join on Seat
Back to the Transformation Notebook
There is a query that merges Contestants and people together.
Instead of loosing this information. We need to load it into PARQUET for use later and we need to keep series in this dataframe
One tweak is to keep the series in the transformed contestant PARQUET file and then make sure it matches S1 S2 etc in the main file
# Join the extra contestant information dfcont = dfc.join(dfp, dfc[“Name”] == dfp[“contestant”], “left_outer”).drop(dfp.contestantID)\ .drop(dfp.contestant).drop(dfp.team).drop(dfp.team_label).drop(dfp.champion)\ .drop(dfp.TMI)
# The resulting DataFrame ‘joined_df’ contains all rows from dftask and matching rows from dfob display(dfcont)
series has been removed from .drop()
Create S1 instead of Series 1 etc in the transformed contestant file.
from pyspark.sql.functions import regexp_replace

# Assuming you have a PySpark DataFrame named dfcont
dfcont = dfcont.withColumn("series_label", regexp_replace("series_label", "Series ", "S"))

# Show the updated DataFrame
dfcont.show()
Back to the Fact Notebook
change to the code when adding in the contestant key
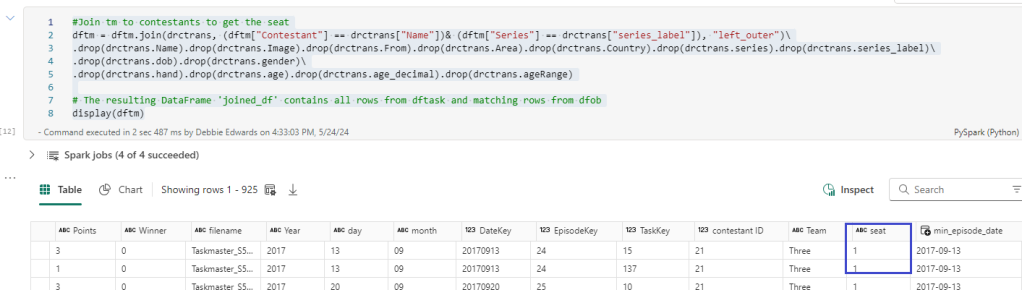
Before we continue. We want to add the seat into the main tm dataframe
#Join tm to contestants to get the seat
dftm = dftm.join(drctrans, (dftm["Contestant"] == drctrans["Name"])& (dftm["Series"] == drctrans["series_label"]), "left_outer")\
.drop(drctrans.Name).drop(drctrans.Image).drop(drctrans.From).drop(drctrans.Area).drop(drctrans.Country).drop(drctrans.series).drop(drctrans.series_label)\
.drop(drctrans.dob).drop(drctrans.gender)\
.drop(drctrans.hand).drop(drctrans.age).drop(drctrans.age_decimal).drop(drctrans.ageRange)

# The resulting DataFrame 'joined_df' contains all rows from dftask and matching rows from dfob
display(dftm)
Here we add in seat from the transformed contestant data
#We want the seat in the main table
dftm = dftm.join(dfc, (dftm["Contestant"] == dfc["ContestantName"])& (dftm["Seat"] ==dfc["Seat"]), "left_outer")\
.drop(dfc.ContestantID).drop(dfc.ContestantName).drop(dfc.Team).drop(dfc.Image).drop(dfc.From).drop(dfc.Area).drop(dfc.Country).drop(dfc.Seat).drop(dfc.Gender)\
.drop(dfc.Hand).drop(dfc.Age).drop(dfc.AgeRange)

# The resulting DataFrame 'joined_df' contains all rows from dftask and matching rows from dfob
display(dftm)
And updated the above code to also join on Seat now we have seat in both the main table and the dim table to get the correct Key.
Back in the SQL endpoint
SELECT e.Series, e.EpisodeName,t.Task, t.TaskType, c.ContestantName, f.Points
FROM [DebbiesFabricLakehouse].[dbo].[facttaskmaster] f
inner join [DebbiesFabricLakehouse].[dbo].[dimepisode] e on f.EpisodeKey = e.EpisodeKey
inner join [DebbiesFabricLakehouse].[dbo].[dimtask] t on t.TaskKey = f.TaskKey
inner join [DebbiesFabricLakehouse].[dbo].[dimcontestant] c ON c.ContestantKey = f.ContestantKey
Where e.Series = 'S1'
AND t.Task = 'Buy a gift for the Taskmaster'
Order by c.ContestantName
The fixes have removed a lot of issues but we are still left with 6 episodes causing issues. like the one above.
looking at the keys. its clearly the task key.
SELECT * FROM [DebbiesFabricLakehouse].[dbo].[dimtask] Where TaskKey IN (64,100)
Back to the Episodes Notebook Attempt 2
The really good thing about the SQL Endpoint is that I can quickly check the work that has been done for issues like this before moving onto the semantic model
Now this issue is highly probable because some tasks across series may have the same Task Name. And its the order that gives it its uniqueness in the dimension
Again, we go back to the fact dataframe to add TaskOrder into the join
Back to the Episodes Notebook Attempt 3
Lets see how this fix has helped
Conclusion
The SQL endpoint has helped us fix
Contestants where a contestant has been on more than one series
Tasks, when a task has the same name
as a developer with a lot of experience in SQL this is a really great way of quickly creating code to check for errors. And you have the graphical functionality if you aren’t a SQL person.
I’ts a real win.
Next. We have our star schema and its been tested. Time to create the Semantic Model.
For our Taskmaster Posts 1 2 3 and 4 we had a really good look at Pyspark using an online dataset. but abandoned it when we realised that the data wasn’t quite as we wanted it and some data sets were missing.
Parts 5 and 6 we got a new data set and created a transform layer and dimensions. Now its time to finally create the fact table
Lets create a new Notebook – Taskmaster Fact V2
Date Keys
Our Date Keys will be integer. if we take a quick look at our Delta PARQUET file
df = spark.sql("SELECT * FROM DebbiesFabricLakehouse.dimdate LIMIT 1000")
display(df)
Out date key is in the following Int Format 20240416 We want the Episode date Key to follow this trend.
At transformation level we created Year month and Day. We just need to merge these to create the date
Now we want to add the Delta PARQUET table to a dataframe. So we can add the key to the dataframe. Then we can create another dataframe with all the keys and the points metric to make the fact table.
dfep = spark.sql("SELECT * FROM DebbiesFabricLakehouse.dimepisode")
display(dfep)
# Add Episode Key to the df
dftm = dftm.join(dfep, (dftm["Series"] == dfep["Series"]) & (dftm["Episode Name"] == dfep["EpisodeName"]), "left_outer")\
.drop(dfep.Series).drop(dfep.EpisodeNo).drop(dfep.EpisodeName)

# The resulting DataFrame 'joined_df' contains all rows from dftask and matching rows from dfob
display(dftm)
And set any null values to -1. Our default not known
dftm = dftm.fillna(-1, subset=[‘EpisodeKey’])
Bring through the Task Key
We can repeat the above to bring in the Task Key
dft = spark.sql("SELECT * FROM DebbiesFabricLakehouse.dimtask")
display(dft)
# Add Task Key to the df
dftm = dftm.join(dft, (dftm["Task"] == dft["Task"]), "left_outer")\
.drop(dft.Task).drop(dft.TaskType).drop(dft.Assignment).drop(dft.TaskOrder)

# The resulting DataFrame 'joined_df' contains all rows from dftask and matching rows from dfob
display(dftm)
dftm = dftm.fillna(-1, subset=['TaskKey'])
Bring in Contestant Key
dfc = spark.sql("SELECT * FROM DebbiesFabricLakehouse.dimtask")
display(dfc)
# Add Contestant Key to the df
dftm = dftm.join(dfc, (dftm["Contestant"] == dfc["ContestantName"]), "left_outer")\
.drop(dfc.ContestantID).drop(dfc.ContestantName).drop(dfc.Team).drop(dfc.Image).drop(dfc.From).drop(dfc.Area).drop(dfc.Country).drop(dfc.Seat).drop(dfc.Gender)\
.drop(dfc.Hand).drop(dfc.Age).drop(dfc.AgeRange)

# The resulting DataFrame 'joined_df' contains all rows from dftask and matching rows from dfob
display(dftm)
dftm = dftm.fillna(-1, subset=['ContestantKey'])
And now we have all of our keys
Partitioning
We want to Partition the fact table by Series date, However, We only have the individual task information.
Lets see if we can add another date Key for Series.
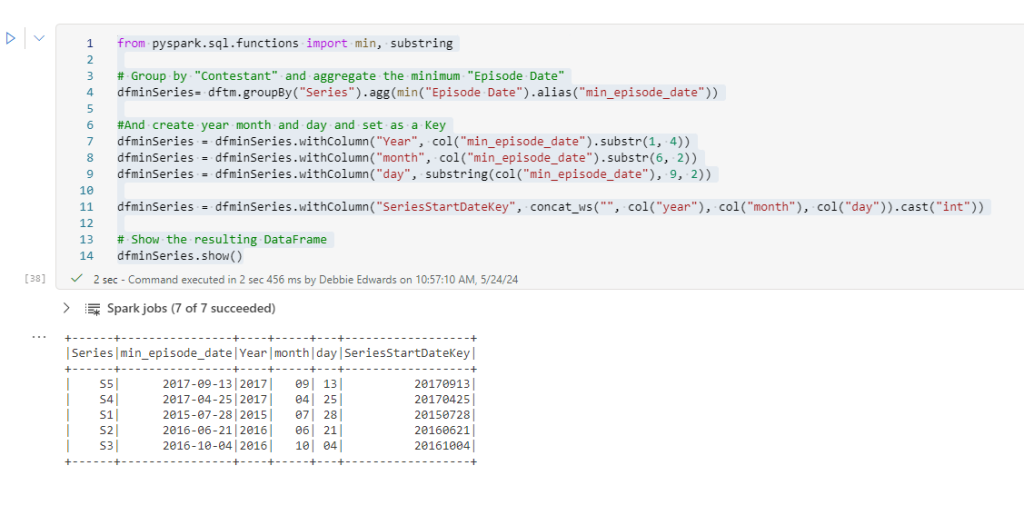
MIN and Group Episode date by Series
from pyspark.sql.functions import min, substring

# Group by "Contestant" and aggregate the minimum "Episode Date"
dfminSeries= dftm.groupBy("Series").agg(min("Episode Date").alias("min_episode_date"))

#And create year month and day and set as a Key
dfminSeries = dfminSeries.withColumn("Year", col("min_episode_date").substr(1, 4))
dfminSeries = dfminSeries.withColumn("month", col("min_episode_date").substr(6, 2))
dfminSeries = dfminSeries.withColumn("day", substring(col("min_episode_date"), 9, 2))

dfminSeries = dfminSeries.withColumn("SeriesStartDateKey", concat_ws("", col("year"), col("month"), col("day")).cast("int"))

# Show the resulting DataFrame
dfminSeries.show()
Merge the New Key into the main dataframe
# Add SeriesStartDateKey Key to the df
dftm = dftm.join(dfminSeries, (dftm["Series"] == dfminSeries["Series"]), "left_outer")\
.drop(dfminSeries.Series).drop(dfminSeries.min_episode_date).drop(dfminSeries.Year).drop(dfminSeries.month).drop(dfminSeries.day)

# The resulting DataFrame 'joined_df' contains all rows from dftask and matching rows from dfob
display(dftm)
This can now be saved to our Delta PARQUET and PARQUET so we have our full set of data to create the star schema.
Delta PARQUET Partitioned.
We now want to Partition our fact table by the SeriesStartDateKey
from delta.tables import DeltaTable

dftmfact.write.mode("overwrite").option("overwriteSchema", "true")\
.partitionBy("SeriesStartDateKey").format("delta").saveAsTable("factTaskmaster")
So Why partition?
Partitioning the Parquet table gives you specific benefits
If we were to just look at one series. The execution engine can identify the partition and only read that partition. it significantly reduces the data scanned.
Faster query performance.
Delta Lake will automatically create the partitions for you when you append data, simplifying data management.
Partitioning is really useful for large datasets. Allowing you to skip partitions.
Lets see what this actually looks like once run.
At this level it looks no different to the unpartitioned Delta PARQUET File.
If we go to the Workspace
Click on the Semantic Model
Then the Lakehouse
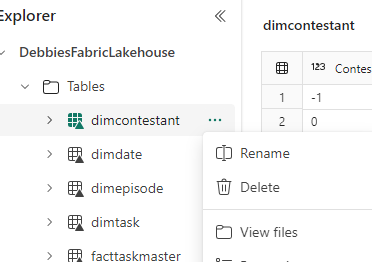
You can right click and View the underlying files.
Lets have a look at another way of doing this.
One Lake File Explorer
Its time to download the One Lake File Explorer which is a new app available with Fabric.
We can now see the One Lake in our File Explorer just like you can in One Drive, And you also get a local copy.
Lets have a look at the Taskmaster Partitioned Delta Table against a None Partitioned Table
None Partitioned
Partitioned
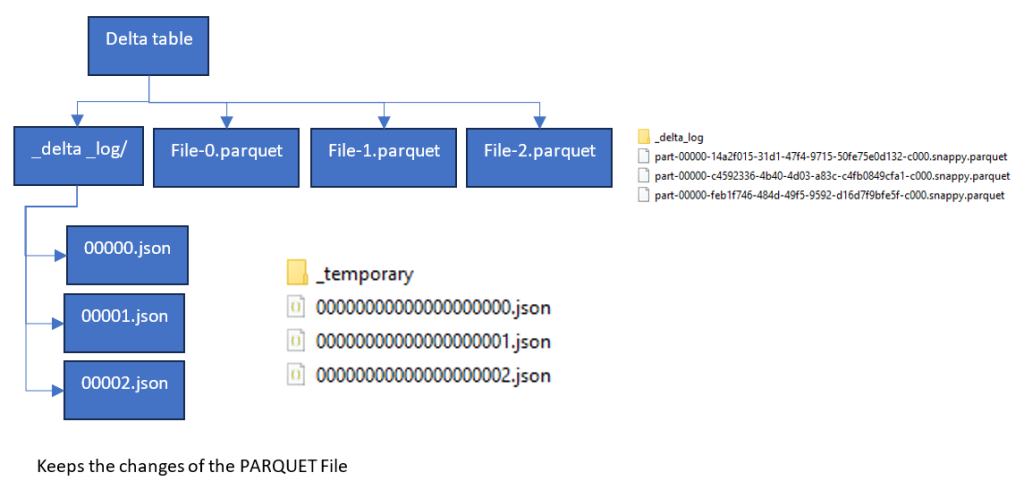
We have 3 parts at 4 kb each for this partition. What is the recommended size?
64 mb to 1 gb is around the file size we want achieve. Our file sizes are small because there isn’t much data at the moment.
So we have 3 change files in the delta log which correspond to the 3 PARQUET Files. the Delta log lets Fabric know which file to go with when we are looking at our data.
So what do we do when we want to clean up old files?
Maintenance – Optimize and VACUUM
We can optimize our file sizes and also Vacuum old data outside of our retention threshold.
Creating the PARQUET Table.
Now its time to create the PARQUET table that is not delta. This is only happening to test functionality between the two.
In a previous post we learned that you couldn’t partition a PARQUET table. You need to update to Delta to do this,
Its important to note that Delta PARQUET and PARQET have the same PARQUET files.
Delta just creates the extra delta log tables to hold the changes. The PARQUET is a columnar storage solution, in the same way as the power BI Columnar data store.
So we now have our gold layer of Facts and Dimensions. Both as PARQUET( unmanaged) and Delta PARQUET (Managed)
In the next post we will see what we can do with these files.