Power BI Streaming Data sets (And Push Data Sets) Part 2

We are going to add some new information into the data set

In Power BI Service, Click Edit against the #Taskmaster dataset

I’m actually going to add 7 more fields

  • Description, Sentiment and Name are Text
  • CreatedAt is a date
  • Count, Favorited and followersCount are Numbers.  Click Done

Return to Microsoft Flow

Edit the flow and go to add rows to a dataset

  • Count is an Expression
  • It is simply set as 1

You can Test and Save

Any new data that comes through will contain these data items

Creating sentiment is slightly more involved but lets go ahead and create sentiment

After Detect Sentiment update your flow with the following logic

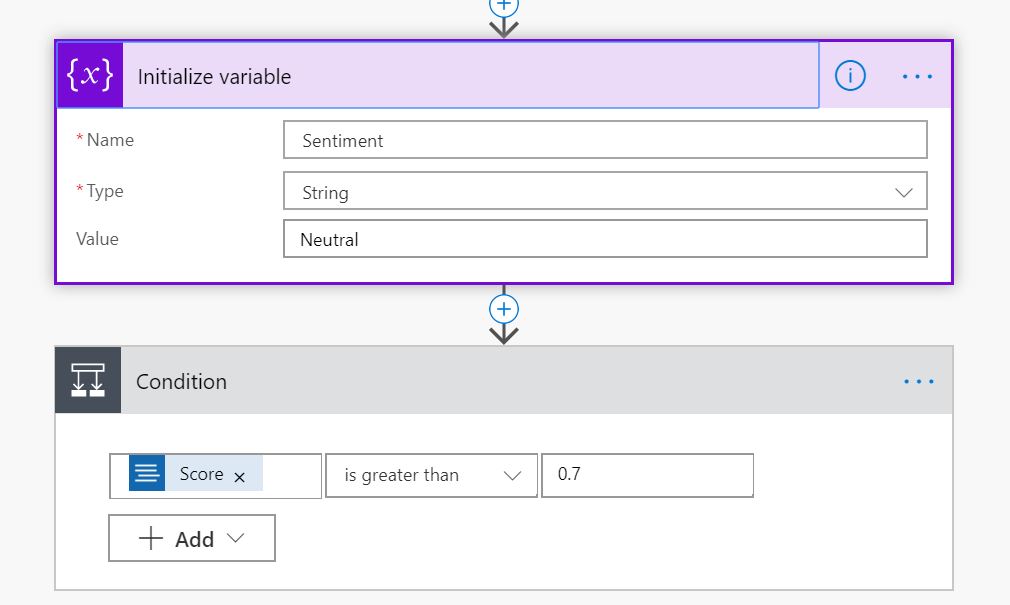
Create Sentiment which is Neutral. If Score is over 0.7 then Positive. If under 0.3 then negative

We can add this to our data set


We now have lots of new information to use in our streaming reports

Back in Power BI Service

I’ve attempted to add a new Custom Streaming Tile to the dashboard based on a Line chart to look at the count of records

Unfortunately this Streaming visual doesn’t seem to work and immediately I can see a fatal flaw with using streaming data set visuals for this kind of data

These visuals are for data that pulls through almost constant stream of data. They are not for data that has a feed that at some points doesn’t have much data coming through. You need to have lots of data in the time frame of the streaming dataset (For example 60 minutes).

I have the #Taskmaster Stream set up for Historical Data Analysis

when Historic data analysis is enabled, the dataset created becomes both a streaming dataset and a push dataset

streaming dataset, has no underlying database

A Push data set

For a push dataset has a few limitations on how much data can be pushed in:

  • 75 max columns
  • 75 max tables
  • 200,000 max rows stored per table in FIFO dataset
  • 5,000,000 max rows stored per table in ‘none retention policy’ dataset

The data is then stored in Power BI and we can actually access it from Desktop.

This means I can create some really nice reports against my taskmaster data set

You cant create Hierarchies of calculated columns over the Push data set. Only Measures. You are very limited on what you can do. The Key Influencers visual is also unable to work with push data which is a shame because this is the perfect visual for analysing positive and negative tweets

I should have brought date across as a date in the first instance because Month is now just a number and I cant change this in Power BI. We have date but only against the very latest data

Time was already in the data set but this consists of date and Time which you cant reset to create a date hierarchy

I cant add day names to the day number(Taskmaster is on on Wednesday so I expect the levels to go up then)

So the push data set is fairly simple to set up but its incredibly limiting to what you can do

Our initial page by Month. I needed to Add Month Name into the Flow

Next I drill through on the 9th of October. the name of the day would be great because taskmaster is on a Wednesday

Finally we drill through to the hourly tweets.

As you can see, We have a few negatives in the data set which, on reading aren’t actually negative. The Cognitive API doesn’t recognise sarcasm for instance.

There you go, We started out with a streaming data set and ended up with a push data set.

The push data set doesn’t need a refresh which is them main reason to go for them.

One last quick thing about this push dataset. When I attempted to republish the report I got the following error

To get past this error I had to delete my report in Power BI Service before trying again. I have never seen this kind of conflict before and I’m assuming its an issue with the Push data set

Power BI Streaming Data sets Part 1

What you need

  • Power BI
  • Microsoft Flow  Or Logic Apps in Azure
  • Cognitive Service. Text Analytics in Azure

I love the show Taskmaster and I really want to see how much other people love taskmaster and when people are tweeting about it.

I want to see everything happening real time in my Power BI report.

For this example, I am going to use a streaming data set. The data will be pushed into the Power BI service, but Power BI will only store the data in a temporary cache which expires. We can give it a window of time to look at.

There is no underlying database with a streaming data set so I wont be able to use my usual report visuals. I will need to use the Streaming visuals available in Power BI

There are other ways to do real time data such as Push Data sets and PubNub streaming datasets but for this example I want to concentrate on the Streaming data set

Log into the power BI Service https://powerbi.microsoft.com/en-us/landing/signin/

I’m going to do this simply in my Workspace

Click on Create in the right hand corner of the screen

Then click on Streaming dataset

Choose API to create an API endpoint

API “a set of functions and procedures that allow the creation of applications which access the features or data of an operating system, application, or other service.”

Our Streaming Dataset will contain these values.

Extra time dimension fields have been created to use drill/down features.

The outcome of the sentiment analysis is placed in the field ‘score’. From 0 to 1 Positive to Negative

Historical data set’ to ‘on’, if you want to save the data for analysis later in time.

Power BI makes a JSON like format (a REST Webservice on the background).

JSON – is an open-standard file format that uses human-readable text to transmit data objects consisting of attribute–value pairs and array data types

REST – ‘Representational State Transfer’. It is primarily used to build Web services that are lightweight, maintainable, and scalable. A service based on REST is called a RESTful service. REST is not dependent on any protocol, but almost every RESTful service uses HTTP as its underlying protocol.

Once you click done, you can see that we have the new data set in our datasets list.

Microsoft Flow / Azure Logic App

The next stop is to create a Microsoft Flow (You can use Azure Logic App if you prefer)

Microsoft Flow is a cloud-based software tool that allows employees to create and automate workflows across multiple applications and services without the need for developer help.

https://flow.microsoft.com.  And sign up for a new account if you need one

Go to My Flows and Automated Flow

Click on When a new tweet is posted

And Create

When you are in the Flow you create New Steps to build up the logic required for your data. The Flow will create the Twitter feed for your Reports.

The first step I have simply added #Taskmaster to the When a new tweet is posted

You will also need to log into your twitter account at this point to get access to tweets

Click on New Step and add an action

The next step is to add some sentiment Analysis. I have used Text Analytics to do this

I have searched for sentiment and can then click on Text Analytics – Detect Sentiment

I have already logged into my Azure Text Analytics

I used the Key, Name and Endpoint details from Azure

You may need to set up your own Cognitive Service in Azure before you do this section.

Next step is to search for Power BI

Select Power BI – Add Rows to a Dataset

Next, add all the information about the RealTimeData streaming dataset

Most of the details can be added from the Dynamic Content picker. As you can see Score comes from the Detect Sentiment group. All the twitter data comes from the very first step ‘When a new tweet is posted ’ Group

The following are the expressions you need to add for the Time fields

  • Time formatDateTime(utcNow(),’MM/dd/yyyy HH:mm:ss’)
  • Month formatDateTime(utcNow(),’MM’)
  • Day dayOfMonth(utcNow())
  • Hour formatDateTime(utcNow(),’HH’)
  • Minute formatDateTime(utcNow(),’mm’)

Save your Workflow

Testing Service in Microsoft Flow

The real time analysis will be triggered by hashtags in Twitter

This service only allows you to get current tweets. No historical tweets can be generated at this point

The visualization tiles will only be kept for an hour so this is the kind of service you need to monitor fast paced information. 

In the Workflow you can save

Click Test and Create a tweet with one of the hashtags in the workflow.

The service will run and you should get pass or fail information.

We can now use this information to create a sentiment report in PowerBI

Back to Power BI Service

We already found the  dataset in the relevant workspace e.g. My Workspace

For this example, click on Create report against the dataset and add a table tile to the report pane. (The data may be refreshing at this level)

Leave like this for the time being. Save your report and pin table visual to dashboard by clicking the pin

I created the table simply to create a report and then a dashboard. Once at dashboard level Custom Streaming data tiles can be added. I am deleting the table when the dashboard is created for simplicity

Click on +Add Tile

Then choose the Custom Streaming data

At present, there isn’t many visualisations to choose from for this type of data

Click Next

The #Taskmaster dataset has been chosen

I am going to create a very simple bar chart to look at the last hours data and see what the sentiment score is based on location

Now I can see the sentiment score by Location.

Azure has provided the Cognitive Text services to analyse the data for a score.

It would be useful to understand what tweets are driving the sentiments by location.

I would also prefer to group on Positive neutral and negative Scores

In my next post I am going to look at how to create a sentiment description and add Description Name and Count into the Flow and streaming dataset

Design a site like this with WordPress.com
Get started