Microsoft Fabric Part 10. Taskmaster Project. Creating the Reporting and the Project File (PBIP)

So far we have created our Delta PARQUET files in the Delta Lake using Notebooks with Pyspark.

We have created a Semantic Model – Storage mode Direct Lake in fabric

Its time to create some visuals. but the question is. Do we create them in Fabric. or in a bpix file?

Reporting Fabric or Pbix File?

Fabric – Centrally managed

Pbix – offline Development and version controlling available for the files with .pbip (Project file)

For this project we are going to go for the hybrid approach. The semantic model in Fabric. And reports developed in Desktop with Devops Version controlling which are published into Fabric.

This gives us better opportunities for version control and collaboration.

Get Data

In Power BI Desktop

Power BI Reporting

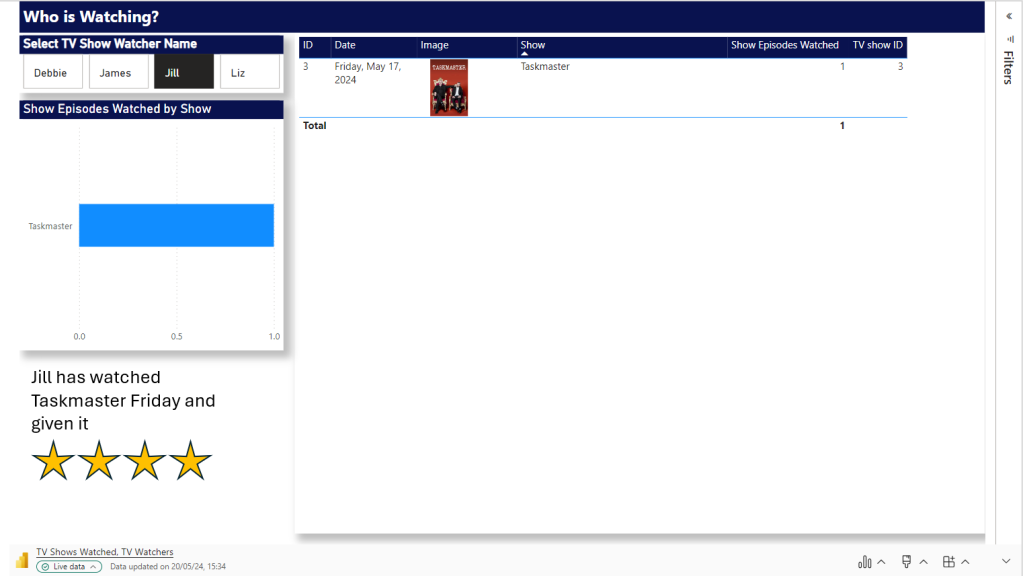
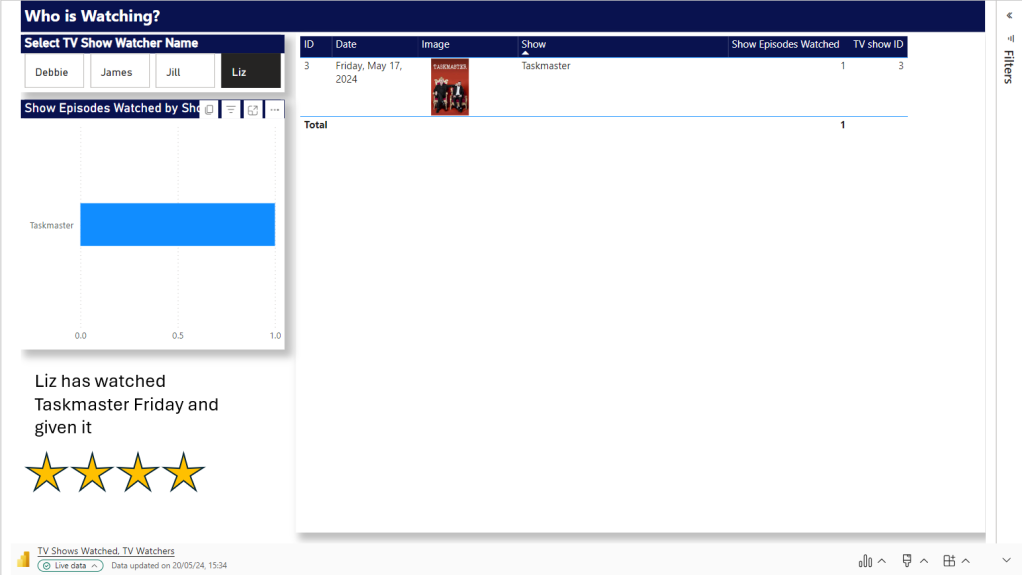
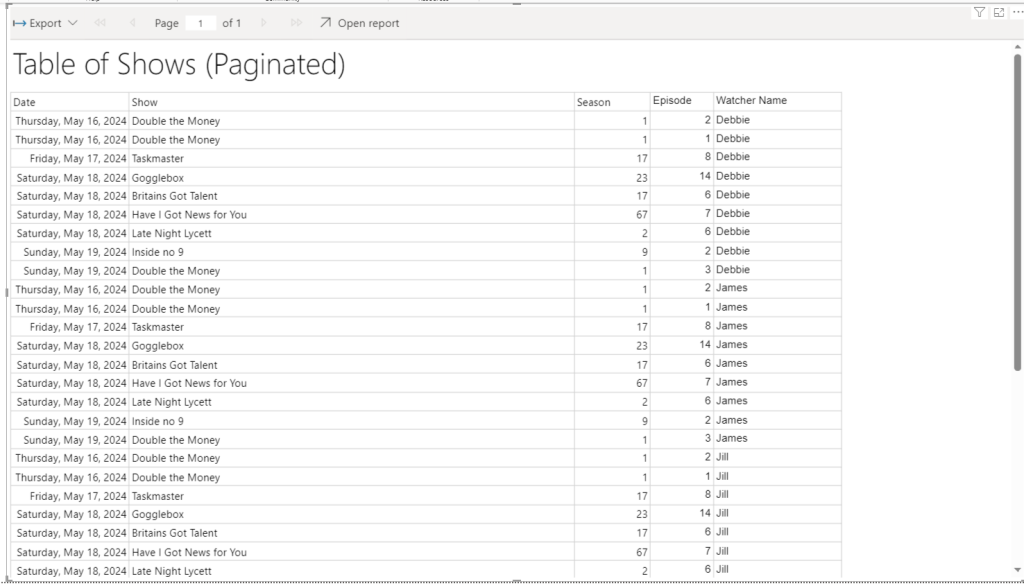
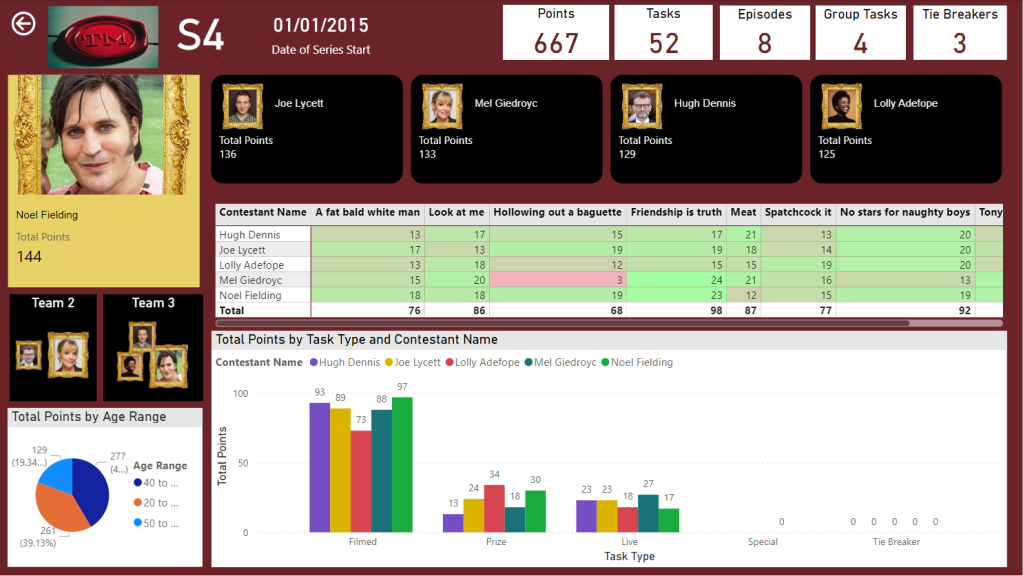
Our front end reporting wont be gone into too much detail here. We are more interested in other areas of Fabric. So here are the basic pages

Drill through to Series

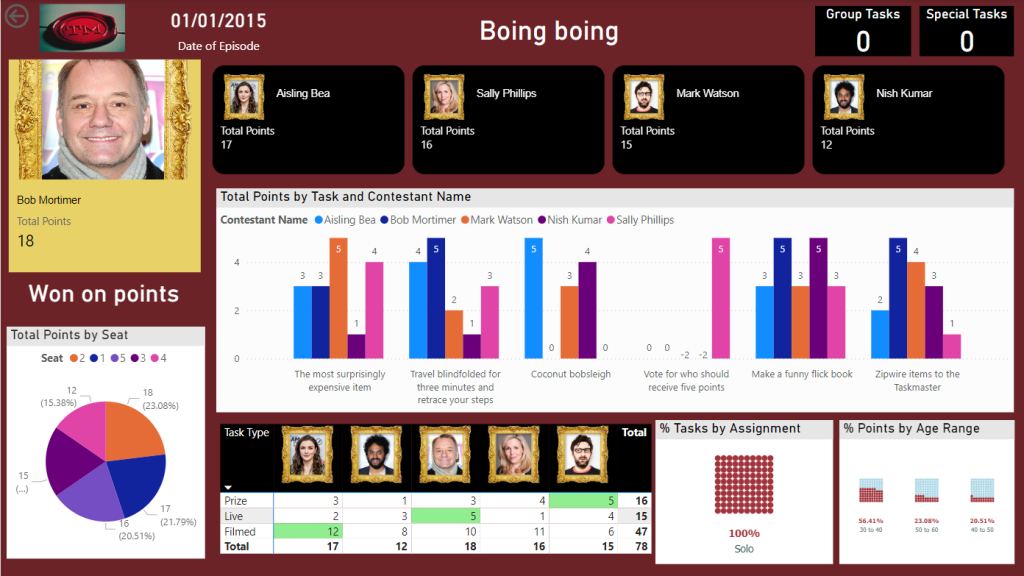
And Drill through to Episode

We now have a pbix Report we can publish through to our Fabric Workspace

Create the Power BI Project (PBIP)

Instead of simply saving as a pbix (black box) file, lets save as a project file instead and see how this can really change how we work with others in Power BI. We should see benefits like:

  • Items are stored in JSON format instead of being unreadable in one file
  • JSON text files are readable and contain the semantic model and report meta data
  • Source Control. Finally real source control for Power BI
  • Amendable by more than one person at a time?
  • The possibility of using (CI/CD) Continuous Integration and Continuous Delivery with Power BI

Saving as a project is in preview so lets turn it on.

Options and Settings / Options

TMDL

This was mentioned in the Power BI June 2024 Updates.

TMDL is the improvement to PBIP as the semantic model file format for the Power BI Project files.

Our Semantic model has been created within Fabric. we might look at this in more detail later.

And now we can Save as

And we can see that its a project in the title.

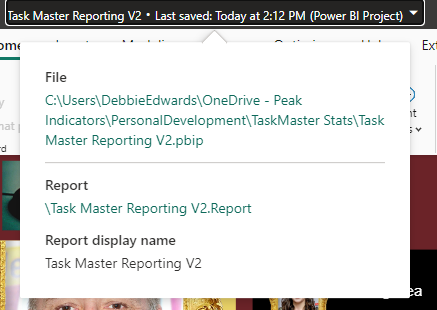
Clicking on the title shows us file paths of the objects. we only have the report because the semantic model has been created within Fabric.

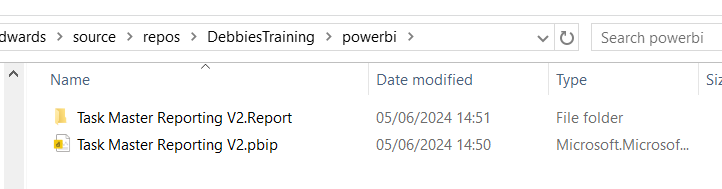
Lets have a look at what we have created in Explorer

The main project file

The reporting folder

Our objects within the reporting folder.

Currently this is in One Drive. We want to get this added into Devops and GIT so it can be added into our full source control process along with all the Fabric code.

Azure DevOps build pipelines for continuous integration

First of all we need to make sure Fabric is connected to Azure Devops which it is

And cloned to a local drive. This was done using Visual Studio but there are other ways you can clone.

It would have been better to have saved into this cloned local project, But we can create a folder and move instead.

Created a Power BI Folder.

And Moved all the objects mentioned above into this folder

Its in local but not yet in the cloud.

I have installed Git Bash to work with https://git-scm.com/downloads

In GIT Bash I change directory to the correct GIT Directory (Local) and us ls to list the information in there

cd source/repos/DebbiesTraining
ls
git status

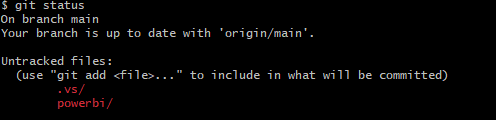
We can see we have powerbi code that is uncommitted and needs pushing to the central GIT repository.

We don’t really want to work on the main branch. A better cleaner process is to create a feature branch. InitialPowerBIFile

git add .
The . in git add . is a wildcard that represents all files and directories. basically telling GIT to stage all changes.

git add powerbi

just adds the power BI folder. We dont really want to do anything with fabric as this is taken care of already.

git commit -m "InitialPowerBIFile"

-m flag is allowing you to provide a commit message in the command. And our command is committing changes

So far we have added the files to the staging area and committed them. Time to Push to the cloud

git push --set-upstream origin InitialPowerBIFile

You will initially get a log in screen to authenticate the push

And this is the line you want to see. We know that we have pushed it to devops

Back in DevOps

Remember to change to the correct branch. You wont see it in Main.

We can see the Power BI Items.

Create a Pull Request

Very simple. We are in Dev and don’t have any reviewers or work on Boards to connect to

Create and Complete

Power BI Files are now in Main

How do you now work with the power BI Project file?

Open the project file from your local source control

lets create a new quick report page for Demographics

And save

Back to GIT

git checkout -b "InitialPowerBIFileAllDemographicsPowerBIPage"
git status
We can see we have modifications
git add .
git commit -m "InitialPowerBIFileAllDemographicsPowerBIPage"
git push --set-upstream origin InitialPowerBIFileAllDemographicsPowerBIPage

Back in Devops

Create and Complete merge. (If you don’t use the reviewing process in Development)

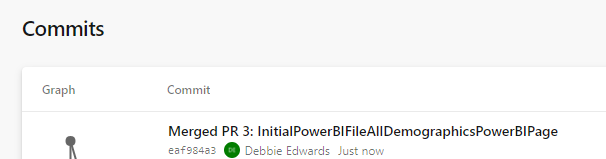
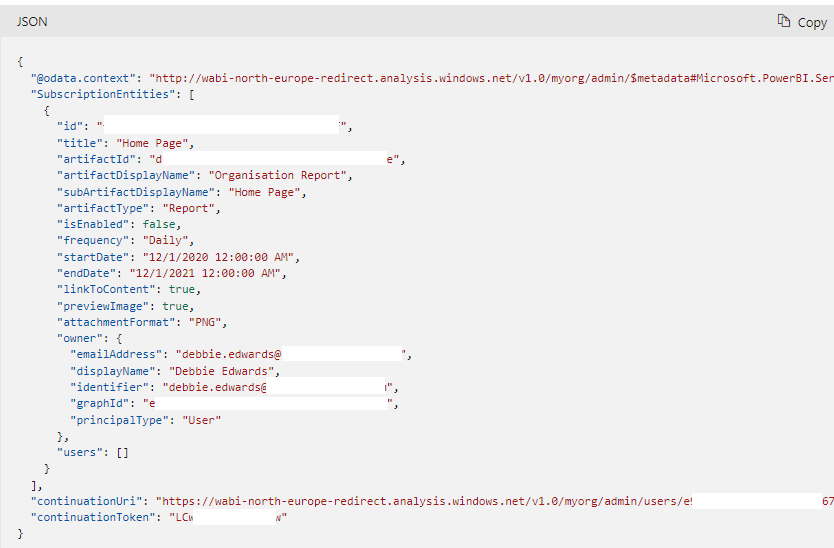
We can see the page is in with lots of work added into this part of the JSON script.

Where is the Semantic Model?

The Semantic model has been created in Fabric.

It says synced on GIT Status.

And here is is in Devops.

Conclusion

The above can be done in Power BI Pro as well as Fabric. Which is good news.

However, my worry about this is that someone creating Pbix Reporting won’t take to the whole GIT process. I suspect that when it comes down to it, it simply wont be done properly.

If you were to go the pbix file route, this would need a lot of governance work to get people to use GIT. At Enterprise level this would be doable but I doubt this would become a real part of the process at self service level.

I did start to question the process. after doing some more reading. It feels like if you created the reporting inside of Fabric, The GIT Process would be simplified. Even though the documentation states that for full GIT control use PBIX. I will be really interested in creating a Power BI Report inside of Fabric to see how this would work in the process at some point.

In the next blogs we are going to look at some new features of Fabric. We can also look at using this feature along with with Devops Pipelines later. (Premium and Fabric only)

Power BI Story Telling in PowerPoint. New Enhancements April 2024

A Previous Project we worked on had a specific requirement.

Project Requirement

Create reporting once a month and allow us to tell the story in narrative via text boxes. The narrative must show against the reports.

The narrative must be formattable. Bold, italic.

  • Bullet point, etc.

Our users don’t want to go to Power BI service. They want the information emailed as PowerPoint slides to the report viewers.

The License is Power BI Pro and we couldn’t use, for example SQL DB for the project to have the transformations before going to Power BI.

There are a lot of slicers in the reports, so there were numerous PowerPoint slides needed based on the specific slicers

There were immediate restrictions based on the requirements.

Restrictions

  1. With a SQL Database we could have used a visual that allowed us to add narrative to each page because it could have been recorded to a database but this was too complex and we didn’t have that option. Also the user might not have been able to format the text enough on the page.
  2. We tried to use the Storytelling in PowerPoint. But, at the time this was live only. You couldn’t snapshot the data. And there were issues in the amount of sub slicers and the users needing to have paginated reporting.

April 2024

As At April. It seems that there have been changes to Storytelling with PowerPoint. And its of interest to see if this could have worked with the above requirements. Based on very basic data.

I am going to use TV shows watched as an example for this.

We start off with a couple of records in excel

Which is imported into Power BI.

A Couple of measures have been created.

Show Episodes Watched = COUNT(Shows[Show])

Total Shows Watched = DISTINCTCOUNT(Shows[Show])

And a Few Basic Visuals have been created

Just enough for us to play with

Lets publish to Service

Then Click on the ellipses and Select Share and Open in PowerPoint

And Now. We go across to a new PowerPoint

Click Insert

Lets choose a few more Visuals and add some text explaining that day.

Lets save this PowerPoint

Now we are moving into another day and adding more data.

Save and Close XLSX. Lets see how this looks in Power BI after a refresh.

So now lets open PowerPoint again.

What we are hoping for is a PowerPoint snapshot for each point in time

So What we have is Live Reporting which now doesn’t match the text added. What we need is to have Business Logic that allows us to Snapshot the Power point.

Each of the 3 Visuals has options and currently we are on Live data.

There are two other options.

Snapshot

Show and image of Power BI data to people with existing access.

so, these are people who can view the reporting in Power BI service,.

Public Snapshot.

Show an image of Power BI data for people with access to this deck

Essentially, a public snapshot allows you to share a static image representation of your Power BI data with a broader audience, even those who don’t have direct access to the report.

We can chose snapshot for this exercise but what will the business process be? How will this work?

The Business Logic

Essentially we want to have a template in place of Power BI visuals and Text.

We want to make a copy of the PowerPoint and send this to users.

The Next day after a Refresh we want to do the same thing and build up PowerPoint Snapshots where the text tells the story on that day

So what happens if we change all three to Snapshot in the slide deck?

Remember, this slide deck will have many visuals and be much more complex.

Lets make a copy of the PowerPoint slide deck and see.

The text has been updated for the current 2 day data source

Every Visual has had to be manually changed to Snapshot.

This could be really problematic if you had to do this every single time you want to create a snapshot.

lets add another days worth of data into Power BI and refresh

Our Live PowerPoint shows the latest.

Our Snapshot still shows

So now we have a problem. We could do this

BUT. Imagine we have a lot of pages and a lot of visuals. This involves manual updates for every PowerPoint snapshot to move each visual from Live to Snapshot.

Do you want to add this in as a process?

Could your team handle this as ongoing business logic?

This change is really great. But because there are manual aspects to it. its still not that efficient and could be error prone. So we are not quite there yet.

The test needs a manual update every month in the PowerPoint and it does need saving manually.

Changing from individual visuals to a full report

Could we simplify from individual visuals to a full report?

For this, the excel data will be taken back to day 1

There are two possibilities here.

We don’t want to embed an image because that will be snapshot data and the users don’t want to go in and do this every month.

We want to try and Embed Live Data and then change to snapshot. After a few tweaks to the Power BI Page.

Embed live Data and copy the link.

You only need to move from Live to Snapshot once instead of three times for an entire report page.

You can leave gaps on the Power BI report to add in a textbox in PowerPoint.

The question is

Would the users be happy with the look of this?

If yes, we can we now have new manual business logic.

Complications in the Logic.

We have made the decision to do a whole page as one but lets complicate the logic and add some more data.

We want a page in PowerPoint for every TV Watcher

Shows

TV Watchers

We are on Day 1. Lets Update Power BI with a new page

First up all, Power Query is refreshed with the new data set and the updated data set.

Not a Star Schema but this is about the end product. the PowerPoint so we can relax on this point for the time being.

Logic – Pull in an entire report page. not just visuals.

After refreshing and publishing. we need to add the new page into our live PowerPoint Embed Live Data.

At this point in time there are only two TV watchers. So we can load in the data twice and set the Slicer. now we have a Page for each Person. including some personal text for the specific person.

Next Step.

To Load in more data. Which means more people could potentially be watching.

How would be logically deal with this?

And will the Slicers stay correct for each page?

So

  • Add in another days worth of data to the xlsx and refresh
  • In Power BI, we manually need to check if we have more watchers. Which we do. there are two. this means, manually another two pages need adding.
  • Open the Live PowerPoint. After A refresh. the good news is the filters have held.
  • Manually create two new Pages and filter to the two new people

Question. Why can’t we just have one page and allow the user to flick through TV watchers?

Because a manager will come and add unique text for each slicer. And without saving this text somewhere that can’t be added dynamically, we cannot do this.

Question. Will the Business Owners be able to add this into the process every snapshot because its a manual process to use the reports to see if there are new users and then add them as pages.

  • Set all pages to Snapshot and Save File as Snapshot. Keeping the Live File as the template.

After a Second test this works. there are certain Manual points to the process. But the user gets what they wanted an a template of Live visuals with room for text.

That can be Saved to Snapshot PPTX.

And have filters set for the sub reports. each watcher gets their own page. We just have to manually understand when we need to add new pages. So we couldn’t do this if we have thousands of watchers with new ones adding every snapshot at a great amount.

Report Builder

Another specific Rule for this project is that there will be alot of tables used and these tables will go over pages (1 to Many)

Because of this. As we go we have to go for the Paginated Option of report Builder.

Question. Would this work with Report Builder Objects?

Using Power BI Report Builder

Add the Data Source as the TV Show Semantic Model created above

Then a Data set

Really nothing fancy here. We just need a table that will go over Pages

The paginated report is saved to Service.

And you can see that immediately we have only Microsoft PowerPoint option. It opens in its own file so can’t be added to the PowerPoint containing Power BI visuals

This doesn’t appear to update. It seems to be a simple Snapshot.

Can we do this another way?

We have created and published the Paginated Report.

In Power BI Desktop

We now have the paginated reporting in Power BI. But its not doing the one thing we needed to use Report Builder for in the first place. Its not paginating the table.

We now can either connect to Live or Snapshot data which is good

But the table is not paginated. It is scrollable. So no need to add in Paginated reporting really. we could stick to the table in Power BI for this functionality

Conclusion

The new Snapshot functionality is super helpful when you don’t want your PowerPoint to simply be one object pointing to the latest data.

we can now create snapshots of information via a live PowerPoint quite quickly. The text manually added into each snapshot PowerPoint will always be specific to that point in time. It needs some manual intervention. But for those users who want to keep things simple. This could be just what is required for this kind of logic.

The PowerPoint even holds the slicer you select on a page.

The problem lies in the extra complexity, if the user requires large tables over many PowerPoint pages.

There are questions here of course. Why do you need large tables? If you do need tables. Would the user be happy to scroll through on a slide?

Note that if you select Public Snapshot. because you are sending out to people without licenses, all functionality is lost because you just get images, So if you have tables with sliders you will lose the additional records. Something to think about when setting up a project like this.

If so, Paginated report can be bypassed, and you have licenses for all viewers. Great. But, if this is a requirement. The new functionality will not work for you.

Lots to think about here. As always every month poses lots of questions for current and past projects.

Power Query Editor – Avoiding the creation of all the helper Queries and Folders in power BI

A current project being worked on starts with a folder in Sharepoint with multiple files that need to be imported together (All with the same Spec)

There are lots of groups of files to import into Power BI

  • We need the File Name – it will be used to create the file snapshot date
  • There is a header over the columns – this needs removing and then the headers promoting

Get Data > Folder creates helper folders that clutter up the back end and aren’t the best solution.

This is the code that gets created

let

    Source = Folder.Files("C:\Users\Name\Company\Project\Data"),

    #"Filtered Rows" = Table.SelectRows(Source, each Text.Contains([Name], "FileName")),

    #"Filtered Hidden Files1" = Table.SelectRows(#"Filtered Rows", each [Attributes]?[Hidden]? <> true),

    #"Invoke Custom Function1" = Table.AddColumn(#"Filtered Hidden Files1", "Transform File (8)", each #"Transform File (8)"([Content])),

    #"Renamed Columns1" = Table.RenameColumns(#"Invoke Custom Function1", {"Name", "Source.Name"}),

    #"Removed Other Columns1" = Table.SelectColumns(#"Renamed Columns1", {"Source.Name", "Transform File (8)"}),

    #"Expanded Table Column1" = Table.ExpandTableColumn(#"Removed Other Columns1", "Transform File (8)", Table.ColumnNames(#"Transform File (8)"(#"Sample File (8)"))),

    #"Promoted Headers" = Table.PromoteHeaders(#"Expanded Table Column1", [PromoteAllScalars=true]),

You don’t want lots of these files and folders cluttering up the beck end of Power BI slowing things down. Try the following.

We are going to run through this again but change what we do

Get Data / File

Let’s collect all FileA files

Select Binary and Name and Right Click – Remove Other Columns

Now go to Add Column – Custom Column

Lets build this function up

Returns the contents of the Excel workbook. Content was added here. Normally when you click the arrow button on Content, this is where Power BI creates the Helper queries for you which we don’t want.

If you click the new custom column (Just next to Table)  you can see the content

Now we can amend this custom column even more

= Table.AddColumn(#"Removed Other Columns", "Custom", each Table.Skip(Excel.Workbook([Content]){0}[Data]))

Table.Skip allows us to skip over the header which start at {0}

And we can even add promote headers to this one bit of code Table.Promoteheaders

= Table.AddColumn(#"Removed Other Columns", "Custom", each Table.PromoteHeaders(Table.Skip(Excel.Workbook([Content]){0}[Data])))

Now we can click the Arrow on the Custom column and bring through all the columns in the table.

No Helper Queries are created and we have done numerous tasks within that one line of code

If you have already created everything you can still do this and grab the code to replace the old code with at the start of each query. then remove the helper queries.

Power BI. Using flags in a junk dimension

We currently have a project where the metrics are actually flags to count whether a record is true or false rather than business metrics like Amount, SaleAmount etc

  • Is something completed? 1 or 0
  • Is something in Development? 1 or 0
  • Is something Out of Scope ? 1 or 0

Etc.

Now, if you left these in the fact table you could sum them to create a measure. But you are left with thousands of rows of just 1s and 0s. against all the keys in the fact table.

Also, they aren’t really metrics. They are true and false flags and as a consequence should not be in a fact table.

The above solutions is not what Kimball would recommend. Kimball recommends a Junk Dimension

Definition from Kimball: — A junk dimension is the combination of several row-level cardinality flags and attributes into a single dimension table rather than modeling them as a separate dimension

It should also be noted that a junk dimension can contain flags and other attributes that don’t quite fit anywhere else.

The star schema looks like this (This is just an example STAR)

Flags are split between two areas D1 and D2 which has also been added to the junk dimension as its basically just a title to split the metrics into two rows in a table.

These two areas are two completely separate low level fact tables, with different metrics and dimensions. think of for example ‘Human resources’ and Marketing’.

we have them here because we have a high level granularity STAR Schema comparing some of the similar flags across the two departments.

This could have been added as a separate dimension but as its just one data item it seemed more sensible to add it here.

So instead of having them repeated over and over again in Fact. We just have every option available set in the junk dimension once. So every single record where F1 is true for Area D1 goes to Key 0.

Summing the flags

The flags are Bool. True false columns so we cant simply sum them up. If we were to do that we would need to convert them to int

Flag int = CONVERT([Flag],INTEGER)

Once converted we could sum them.

SUM([Flag Int]

The junk dimension is used against multiple fact tables and here is the first issue.

If we create DAX this way, there is no mention of the central fact table. Therefore if you use it it just counts all the true flags in the dimension, completely separately from the fact table.

We need that join to the fact table in the DAX

So we dont need to Convert the Flag to an int to use it in a measure. We can do the following:

Measure is true = CALCULATE(COUNT(‘Fact1′[JunkKey]),’Dim Junk'[Flag]=TRUE()|| ‘Dim Junk'[Area] = “D1” )

CALCULATE

The CALCULATE function evaluates the Count of the Junk keys that are already integer within the fact table. This is important because we have now created a reference to one of the fact tables.

And we are counting where the Flag is equal to True in the Dim

||

Allows us to add another and. In this case we are only looking at the D1 area.

We can add these logically into the separate fact tables

Measure is true = CALCULATE(COUNT(‘Fact2′[JunkKey]),’Dim Junk'[Flag]=TRUE()|| ‘Dim Junk'[Area] = “D1” )

And now we have a fact table with measures we can use for reporting. And we have made sure out Power BI data model is as small as it can be in memory.

Power BI Concatenating two measures together under one column header for a table display

Another requirement came through for a table that showed the current month figures against last months figures,

However, to save space the two values were in the same column, last month contained in a ()

So part one was to create the date time intelligence for last month,

And then to attempt to concatenate the two figures just for the table

Time intelligence to see this time last month

There are various ways of doing this

Prev Month At Risk = CALCULATE([At Risk],PARALLELPERIOD('Dim'[Date], -1,MONTH))

Here we use CALCULATE to evaluate the SUM of At Risk (created in a base measure already) in a modified filter context. Which is PARALLELPERIOD using the date from the Date Dim.

PARALLELPERIOD takes the current set of dates (For us its month and year) and shifts the first and last date in the period specified a number of intervals. -1 takes us back a month.

This is the chosen method but you can also use

CALCULATE([At Risk],DATEADD(‘DimDate'[Date],-1,MONTH))
DATEADD returns a table that contains dates shifted forwards or backwards in time the number of intervals from the date in the current context. Again we are sing Month and Year in the current Context.

Returns a table that contains a column of dates, shifted either forward or backward in time by the specified number of intervals from the dates in the current context

PREVIOUSMONTH('Dim Report Snapshot Date'[Date]))

PREVIOUSMONTH returns all dates from the previous month using the first date in your context. As we are using month, our first date is 0103 so it goes back to 0102

CALCULATE([Risk],SAMEPERIODLASTYEAR('DimDate'[Date])))

Returns a table (Its a table expression) Returns a single column of date time values from the same period in your current context from last year, SAMEPERIODLAST Year can only go back a year.

Concatenate current month and Last Month into one single value

This is for a table only. Not to be used for Proper analytics.

So first we need to convert the number into a string.

And then we can concatenate. The following was used

At Risk =
VAR varMeasure = CONVERT([At Risk],STRING)

VAR varPrev = CONVERT([At Risk],STRING)

VAR varConcata = CONCATENATE(varMeasure,”(“)

VAR varConcatb = CONCATENATE(varPrev,”)”)

RETURN

CONCATENATE(varConcata,varConcatb)

There will be lots of other ways to do this but I decided on the following
Creating Variables to hold:

  • The measure converted to a string
  • The previous (Month) measure converted to a string
  • CONCATENATE (You can only concatenate two things using this method) so The measure was concatenated with (
  • CONCATENATE, Doing the second part of the concatenation. The previous Month String value with )
  • Finally we return a Concatenation of a and B so make a string value we can use for the table.

To CONCATENATE more that two columns you can use

Column D = [column A] & " - " & [column B] & " - " & [column B]

So were we have 5 measures and a total. To view them in the table under one column header we have concatenated them together.

Power BI – Deployment Pipeline Quick Tips – Setting dataflow Environment sources and Publishing (Direct Query) Datasets containing multiple Datasets

You need Premium or Premium Per user to work with Deployment Pipelines

This happens right at the beginning of the Deployment Pipeline process when you have just added Dev to the Pipeline and you need to deploy Test and Prod

Tip – Changing Data source Rules for Dataflow

You now need to deploy your dev dataflow which is connected to the dev database into Test. You cant change the data source rule until you have a data source to work with.

After deploy, the test dataflow is still against the dev data source (Azure SQL database)

Click Test Deployment Settings

Deployment Rules – Click on your dataflow

Data Source Rules – Change This (Your Dev Details) to this (Select and choose your Test SQL Server and Database)

And Save

The tip here is to then deploy your dataflow Dev to Test again. Only then will it use the new settings.

To check go back to the workspace and go to settings for the dataflow

Deploying Datasets that contain multiple data sets

This is specific to setting up Power BI With the Following Option

With this option set you can create smaller data sets, probably based on a star schema. Then if required you can connect to another data set. And then connect to more data sets and data. Without this option you can only connect to one data set.

This has changed from a Direct Query Connection (The standard way. 1 Data Set Only) to Live Query Connection (Analysis Services and Multiple data sets)

Tip- Move your hybrid data set after the original data sets

So here, what we can do is move the dataflows, and datasets A B and C at the same time.

Once completed move Star A B and C so it goes after the schemas its based on

Then do the report.

If you try and do them all together you will get errors.

So these are just a couple of tips to look out for when setting up your Pipelines for the first time. And if you use the setting that allows you to connect to multiple data sets.

Power BI – App Viewers can’t see the data in the report

We recently had an issue where a shared dataset (pbix) had been set up over a SQL Database.

This was then published to Power BI

A new pbix was created.

Power Platform – Power BI datasets was chosen and the shared dataset was selected. Then reports were created and published to Service.

An App was set up and a user was added to view the report.

However when they came to view the report, they would see the report but not the data. All they had was messages about not having access to the data.

At first we struggled to understand what the problem was and then it started to add up.

Previously we had worked on a project with dataflows and multiple datasets being used for one report. So we have the following ticked

This worked great for this specific project. We were in Premium. There were dataflows.

However, this project is just a test report, not set up in Premium and without dataflows.

The above setting is a blanket setting that sets every pbix to you create from Live Query to Direct Query

Live Query is where it live connects to just one data set only and then when you publish your report over the data set it uses that initial shared dataset and doesn’t create a new data set because the DAX, model etc. is all set up in that specific data set.

Direct Query is a slight change. You Direct Query the data source (the data set) and crucially you can also direct Query other data sets, even other data sources like data bases and flat files all together. But that Shared Data set is also direct querying its data source.

Direct query is a good one for real time analysis from a transactional database. But many DAX expressions aren’t available over Direct Query straight over a database. For example, time based intelligence DAX. So the reports are much simpler in Power BI. And more complex to set up at the database end for the users.

In this instance, the reason we have issues is because there is no dataflow at the start of the Power BI process. 

If you are using Direct Query over a dataflow, the data is imported into Power BI into the dataflow. The dataset Direct Queries the Dataflow.  Your users are then added to the workspace App and they can see the data because they have access to the dataflow.

Without the dataflow, your data set is calling data directly as Direct Query.  Which is essentially where Power BI always calls from the data base and not from the Power BI Columnar data store.

So the users were opening up the App, and trying to access data straight from the database because there is no dataflow holding the data. Because the user doesn’t have access to the database, there is no data to be seen.

So the issue here I think is that Power BI should be allowing us to switch this option on and off, depending up the choices we make on set up. Not just have it as a blanket option over ever single report like it does now. 

Without dataflows you want to Live connect to the shared dataset. Not Direct Query right down to the datasource.

With a dataflow its fine to Direct Query because the users have access to the dataflow data in the workspace

Power BI Datamarts (New May 2022)

Difference between dataflows, datamarts and datasets

Datasets

Lets have a quick look at the history of the data set

Here we see everything in one pbix file. Only one person can work with the file at any one time. We cant reuse anything or work on anything separately. Our dataset is in the one pbix file. dependent upon Import or Direct query the dataset is in the Power BI Columnar Data storage.

the only use case for this now would be if you were simply working on your own small projects outside of a working team environment in Pro or even Power BI Free license.

Here we can see that the dataset is now separate from the dataflow (the data transformation) and the actual reporting pbix files. the Dataset is the model and the measures.

This is currently the use case that we use. However our main transformations are outside of this within the SQL database.

Dataflows

Dataflows are packaged ETL Type transformations. We are packaging up into a dataflow to be reused. these are really good for reusable dimensions. Like Dates. Locations, etc.

They are for individual datasets that you bring together later on in the process

Dataflow data sits in a data lake so you can use them for machine learning tasks really easily. this is one of the big wins for dataflows.

But can you do all of your transformations in them?

Some of the Power Query transformations can be really time consuming and memory intensive. Especially when you are trying to create a star schema from transactional tables and lots of separate data sources.

You also need to think about Premium or Pro because there are certain things that you can’t do in Pro within the dataflow because it needs Premium In Lake compute (Append and duplicate for example)

If you do all this in your Pbix file this can easily grind the file to a halt. Moving it to a dataflow means that this can be done at a different time and you refresh your pbix file with work that has already been done.

However even this can be too much. Imagine you are developing, you have to go to the dataflow and refresh. Power BI has to grind through all the steps and the steps are really complicated.

You can go wrong. Backtrack by creating more steps and leave the incorrect steps in very easily. Making a great number of activities. All the activities have to be refreshed. Even the wrong ones.

It is still recommended to do the heavy processing work outside of Power BI. say with Azure (Data Factory and SQL Database)

Then when Developing in the dataflow you can do things quickly and they can be transferred to the SQL Database at another time. Still allowing the user to develop quickly.

Datamarts

The new Premium Feature announced at Microsoft Build May 2022

The Self Service Database. it doesn’t replace the data warehouse.

Datamarts allow you to combine and work with data from all sources in a single place.

Datamarts replace the step we would call the shared dataset previously.

We would have a pbix file where we would bring in the dataflow (Which is used over the SQL datamart and we do all the friendly naming in the dataflow)

The Shared Data set contains the model and measures (I don’t use calculated columns as they can bloat the model)

The pbix file would be published to service. Then report pbix files are created over the top of the published dataset. In this example there are two pbix files.

Datamarts allow you to just have the one report pbix file instead.

Premium or PPU Only So as a user you have to understand that with Power BI Pro this isn’t a feature we can use.

Datamarts are about self service data analytics. Bridging the gap between business users and IT. How do we create the data warehouse without having to go to central IT?

No Code Low Code

But does it mean you don’t have to create your database and ELT inside Azure?

There is still the need to create full Enterprise solutions and SQL Datamarts and wearehouses.

Just like with the dataflows, transforming to an OLAP schema from OLTP (Or datasources that aren’t even OTLP sources but just scattered data sources) can be very memory and processing intensive.

Creating a data mart with better control and governance should still be done pre Power BI for large more complex based projects.

So what other use cases and plus points are there for the datamart?

Data Refresh

Another good example of a use case for the datamart is that datamarts Refresh the data flow then then dataset. No need to use APIs to run the datasets straight after the dataflows. Or setting up refreshes on Power BI for both, guessing the amount of time it will take to run the dataflow

Our Datamart users

This is a great options is for people who use macs and can’t use Desktop. It enables a SQL Endpoint for you

Datamarts are geared towards Self Service. the Citizen Data Analyst.

a person who creates or generates models that leverage predictive or prescriptive analytics but whose primary job function is outside of the field of statistics and analytics.”

Gartner

Would you use the Datamart in an Enterprise setting?

In an enterprise setting you have Data Engineers and developers. You will have a BI team as well as analysts. There is a place for the data mart for the self service bronze approach. Still with the aim to move to the more governed approach of having the logic set in a SQL Database centrally.

Our analysts creating self service probably aren’t creating star schemas and fully attempting to transform within the dataflow. This will still need to be done by the BI Devs.

However its probably that without the datamart, all the relationships and measures were created inside one pbix file and there may not be a SQL Database layer. Just datasets created from files etc.

The datamart allows for a better governed blended approach

Would a Developer or a data engineer use a datamart?

The BI Developers and Data Engineers are probably working outside of Power BI in the SQL Database and with Data factory or other ETL packages. however they can now leverage the datamart features if they want to quickly look at the data for this project.

The Datamart model

So how does this change out datasets and dataflow models above?

We can see how the Datamart unifies the dataflow and the dataset that is usually created in the shared pbix files. It also raises lots of questions.

  • Do we still create dataflows separately?
  • What is this new layer. the SQL Database?
  • If we have our Datamart in SQL do we need to use the datamart in Power BI?

The Datamart SQL Database layer

Dataflows stores the data in a datalake

Datamarts are stored in an Azure SQL Database. You will hear this being called the data warehouse . When we think of the DW we think in terms of The Star Schemas.

If your logic is complex and the data sets are large its always best to use technologies outside of Power BI (Data factory, SQL Database)

The data warehouse that is being spoken about here is simply data storage, like your staging layer in the Azure SQL database. Our users here are probably not users that understand how to create OLAP schemas. So you can see this as your staging layer

Then you have the dataset layer with the relationships, calculations, so the SQL layer is the middle layer between the dataflow and the data set.

But what can you do with the SQL Layer and what can’t you do?

You cant write DDL (ALTER, CREATE) or DML (INSERT UPDATE, DELETE etc) Queries. Just DQL (SELECT).

So you can’t write stored procedures or do any real transformations within SQL. This still has to be done in the dataflow. You can only query it.

The SQL Database is not part of the transform layer

How to set up the Datamart in Power BI service

New DataMart

At the moment you can set this in Admin tenant settings. You either allow the whole organisation to use datasets or no one. Hopefully they will change this soon so you can allow a small group of users to test the functionality.

I will do another example post soon but basically, you can create the model (really great for Mac users who can’t use Desktop)

And you can also write measures in DAX. My main concern here is that simple base measures are fine but for complex ones. I always test them against a visual and you don’t have the ability to do this here.

Also, you cant create calculate columns or calculated tables. This is a good thing. you don’t want to be creating these anyway as they bloat your model due to none compression..

Behind the scenes Managed SQL Server is running the SQL layer and you still have the Power BI Columnar data store layer for the data set.

Row level security can also be done here. At SQL Layer and the dataset layer. (Two layers are created by applying security on the data set as you would usually do, but in service, not in desktop)

Ad Hoc Analysis can be done in Power Query by the user on the SQL layer, and if you know SQL you can write T SQL too within Power Query

You can also take your SQL Endpoint into SSMS for example (Read Only)

You can manage Roles in the Datamart and Assign Internal and External Users to the Role. Or Share the Endpoint with them if XMLA endpoints are on.

This is a really exciting new development for the Self Service side of Power BI. We now need to understand where it sits. Who our users are and how we can apply it to projects?

Questions

If you create reporting in Power BI service at the moment you cant publish to other workspaces or tenants. That’s where a pbix file comes in that is separate to Service and you can re publish to other tenants. How will the datamart help with this kind of functionality?

What are the future developments of the datamart going to be? for example Slowly changing dimensions, monitoring, version control?

Will this cost any more money over having a Preview license?

Will the SQL Layer ever become part of the transform functionality

Power BI February 2022 Updates Dynamic M Query Parameters

Now supports SQL Server and more data sources

But what are Dynamic M Query Parameters and what does this mean?

It feels like they have been upgraded to use with direct query data sources so you can restrict the amount of data being asked for at the lowest level.

Lets have a look at a simple example using Taxi data from a Microsoft learning path.

First of all you need to open Power BI – Options and Settings – Options

Its in Preview so make sure that is ticked before continuing

Get Data Azure SQL Database (The guidance mentions SQL Server but it seems that both can be used for this test)

Load

Then go to Transform data.

Right Click on trip fares to get to advanced editor

let    
Source = Sql.Database("dataengineering-sqlserv.database.windows.net", "taxi-data-db"),    dbo_TripFares = Source{[Schema="dbo",Item="TripFares"]}[Data]
in   
 dbo_TripFares

Its currently bound to a table but we need to bind it to a query for this process.

Click the cog against source.

Go into Advanced Options and add the SQL Statement

SELECT * FROM dbo.TripFares

And then go back and look at advanced editor

let   
Source = Sql.Database("dataengineering-sqlserv.database.windows.net", "taxi-data-db", [Query="SELECT * FROM dbo.TripFares"]),    
dbo_TripFares = Source{[Schema="dbo",Item="TripFares"]}[Data]
in    
dbo_TripFares

So now, its nearly bound to a query but you will note that it looks like the table is erroring.

You can go back to Advanced Editor and change to

let
Source = Sql.Database("dataengineering-sqlserv.database.windows.net", "taxi-data-db", 
[Query="SELECT * FROM dbo.TripFares"])in   
 Source

 We only need the query and not dbo_TripFares

Now we can add the  Dynamic M Query parameters. I will go for an easy one first as a demo.

And then I change the advanced code again

let 
Source = Sql.Database("dataengineering-sqlserv.database.windows.net", "taxi-data-db", [Query="SELECT * FROM dbo.TripFares Where payment_type = '" & paramPaymentType & "'"])
in    
#"Source"

Note the new WHERE Clause that concatenates the value in our parameter

It will read in SQL SELECT * FROM dbo.TripFares Where payment_type = ‘CRD’

When it runs the first time you are asked to approve and you can actually see the SQL its going to use which is good. (Note I had to change to CSH to get the message up but I am running with CRD)

When it comes through its restricting to the selected payment type

We are going to change the code again

let    
filterQueryPaymentType = "SELECT * FROM dbo.TripFares Where payment_type = '" & paramPaymentType & "'",    
Source = Sql.Database("dataengineering-sqlserv.database.windows.net", "taxi-data-db", 
[Query=filterQueryPaymentType])
in  
#"Source"

This sets the SQL command first and we pass the Filter query into the data source

Now we know that the query works. Lets use it in Power BI Reporting and Assign to table.

This will need a lookup table of all the payment types to work

I am going to simply create the reference table in M

let
Source = Sql.Database("dataengineering-sqlserv.database.windows.net", "taxi-data-db", 
[Query="SELECT DISTINCT payment_Type FROM dbo.TripFares"])
in    #"Source"

Close and Apply

Now bind the table to the parameter in Modelling tab

Click on Payment_Type column. Advanced. Bind to parameter

Click Continue

A multi select is not going to be used for this demo

I have added a quick table. the metrics have come through as strings and there will be lots of things you need to test in direct query mode but I will ignore for the time being.

I dragged in Payment type from the Payment Type lookup into a slicer.

Click the slicer and see your data change. every time you click the slicer a direct query will happen but only for the payment type selected, hopefully making things much quicker.

And there you go. You have set up a restricted direct query. This will help with any direct query reports you need to create based on real time data.

You are still hitting the SQL DB though a lot so this would need thinking out.

And remember, Direct query doesnt give you the full Power BI reporting suite so your reports may be more basic. And usually I like to work with Star schemas but here we have the extra complexity of lookup tables to work with the parameters.

I will be looking at a date time example soon hopefully. This is clearly an extremely important piece of the Direct query real time puzzle.

Power BI Admin APIs to return a list of email subscriptions

Get Dashboard Subscriptions brings back a list of everyone who has subscribed to a dashboard

What is a Power BI Subscription?

Subscriptions are a great way to assign yourself and other users to get emails regarding report content.

There are certain governance rules we follow.

  1. Report viewers views content via an app. We don’t want report viewers coming into the App workspace. we want them to see carefully selected and brought together content.
  2. If we use Subscriptions we want to push though a really nice screen shot of a report that changes and gets the users wanting to come and see more content within that app. therefore we always have a report or dashboard with visuals that don’t need scroll bars to engage the viewer so they want to see more.
  3. because of this, we want to be able to subscribe people to App content

Go to an App. Note you can add your Subscription here which is a link to the dashboard

for this example, the App dashboard is subscribed to

then we go to try it out from the Microsoft API Page

Dashboard Subscriptions

https://docs.microsoft.com/en-gb/rest/api/power-bi/admin/dashboards-get-dashboard-subscriptions-as-admin

and try the API

Add the Dashboard ID to parameters

But this is where logic is not quite working (the hope is that this will resolve fairly quickly). The above API doesn’t give you information back if you subscribe via the app. Only when you subscribe to the actual Dashboard in the workspace.

We want all our report viewers accessing the pre built app so this is where the information is most required.

When the user is added to a dashboard subscription in the workspace. The API is tested again.

What this can show us is anyone in the workspaces that has subscribed to the actual dashboard.  We want all viewers with App access.

Get report Subscriptions as Admin

https://docs.microsoft.com/en-gb/rest/api/power-bi/admin/reports-get-report-subscriptions-as-admin

This is the same as above but with reports

Get user Subscriptions as Admin

https://docs.microsoft.com/en-gb/rest/api/power-bi/admin/users-get-user-subscriptions-as-admin

I get my user ID from Azure Active Directory

And see what I’m subscribed too but again, only workspace content

Logically, I feel like our viewers should be subscribing through the apps

this is really good stuff but I feel like they need to resolve the issue with Apps. Apps are the go to areas for users to view content so this is where we want people to subscribe too.

If you look at the information coming back. Here we can see the artifact type is report but there is no where that mentions if the report is in an App or in the workspace and I feel like this is actually important information. I only know because I have tested against both the App and the workspace.

If this could be resolved these APIs would be really useful to help us understand the subscription uptake.

Design a site like this with WordPress.com
Get started