After 14 years using Microsoft On Premise BI Tools (SQL Server, Reporting Services, Integration Services and Analysis Services) Its time to embrace Business Intelligence in the cloud.
In part 1 of our initial lessons learned in Fabric blog, we looked at Data Engineering components. Our transformed dimensions and fact tables are now stored in Delta Parquet format within the Fabric Gold Lakehouse.
Now its time to look at what we can do with the Power BI Fabric functionality. Lets build our Semantic model and Reports.
The Semantic Model
Previously, the semantic model was created in Power BI Desktop. We could then create another desktop file and connect to the semantic model that had been published to the power BI Service.
With Fabric. You create the semantic model in the Fabric workspace.
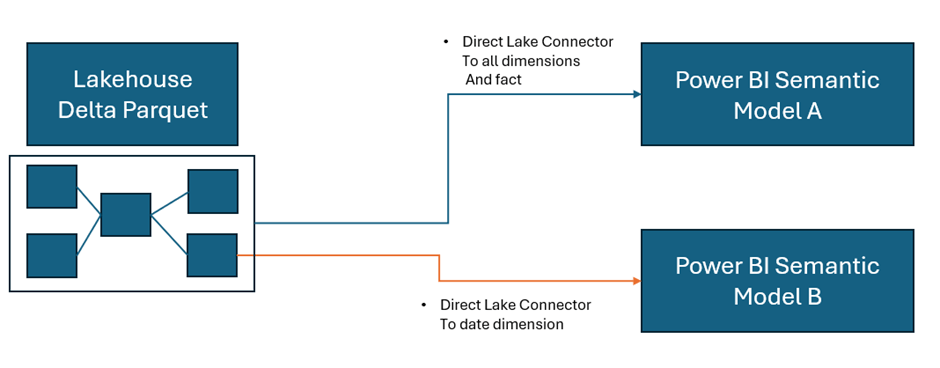
We are going to use Direct Lake connection to the Delta Parquet files. As a consequence we don’t need to create dataflows. Lets look at how this looked previously.
Without the SQL DB, with Power BI Premium. Data flows can get complex, as usually the transformations happen within the SQL database. Here they are used to simply store the data centrally before being imported into the semantic model.
You can use the data flows in multiple semantic models. For example, your date dimension could be reused in many models.
Now, we are looking at the following logic.
As a consequence, this project has been simplified to Delta Parquet and Semantic model.
In the Lakehouse, go to SQL analytics endpoint
At the bottom of the screen we have a model view. This is the Default Model view
This takes us to the Semantic Model. However, when trying to update the default model we get hit with errors
After looking at some of these issues online, it would appear that currently the ‘default’ semantic model is quite glitchy and many people are having issues with it.
People are using work arounds by creating their own semantic models rather than using the default semantic model. So currently, the default is left alone and a new semantic model is created.
Back in the Lakehouse
Choose New Semantic Model
And work in the same way as you would within your Power BI desktop file. Note that we don’t have to publish. The model auto saves.
And you can then commit your model changes to your GIT repository. Eventually creating versions of your model. You can quickly create a new report in Fabric to check your DAX as you go. This is a real change from how we used to work. Where the power BI PBIX file was simply a black box file, with no opportunities to store the code in GIT.
Notice the connections on each object
Direct Lake. Power BI directly connects to the Delta Parquet file. Just like Power BI, the file is a columnar data store, and we do not lose any DAX functionality.
Power BI Reporting
As we have seen. You can create reports directly in Fabric. A big question is, is Power BI desktop still the best thing to use?
Again I think the answer to this question is definitely yes. Although the Fabric reports can be good for quick data model testing.
Desktop allows for Offline development
Power BI Desktop can be more responsive that working on the cloud
Power BI reporting allows for better version control. You can save locally and publish to the service when ready.
Desktop integration with other external tools and services
Desktop provides more options and flexibility that reporting within Fabric.
With this in mind. Another update we can take advantage of is the Power BI PBIP (Project) desktop files. PBIP allows for version control and collaboration. Finally, Our Power BI files are broken up and code can be stored in out GIT repositories.
PBIP (the Power BI Project File)
Get Data
In Power BI Desktop you can access your Power BI semantic models
Create reports from the Semantic model(s) in Fabric.
Create the Power BI Project (PBIP)
Instead of simply saving as a pbix (black box) file, Save as a project file and see how this can really change how you work. We should see benefits like:
Items are stored in JSON format instead of being unreadable in one file
JSON text files are readable and contain the semantic model and report meta data
Source Control. Finally real source control for Power BI
Amendable by more than one person at a time
The possibility of using (CI/CD) Continuous Integration and Continuous Delivery with Power BI
Saving as a project is (Currently) in preview so lets turn it on.
Options and Settings / Options
And now we can Save as report.pbip
After saving, the project is stated in the title. Lets have a look at what has been created in Explorer
The main project file
The reporting folder
The objects within the reporting folder.
For the initial test. The pbip was save to One Drive. It needs to get added into Devops so it can be added into the full source control process along with all the Fabric code.
Azure DevOps: build pipelines for continuous integration
Ensure Fabric is already connected to Azure Devops And cloned to a local drive.
Add a powerbi folder in the local repository and all the Power BI Objects are moved here.
Using GIT Bash you can push the powerBI files up to the central repository by creating a new branch to work on
Add and commit the changes. Then Push to the cloud
Back in DevOps
We can see the Power BI Items. If you have pushed to a branch, you can then create a pull request to pull the new power BI files over into main.
To work with the file again, remember to open the (PBIP) project file from your local repository. Then you can work in Git Bash to once again. Create a new branch. Add, Commit and Push the changes.
For self service Power BI developers, this may be something that takes time to embed itself, since the process is more complex and you need to have some understanding of version control but it is really worthwhile to train your developers and build this into your standard procedures. Especially with the Silver and Gold standard (Promoted and Certified) content.
The Fabric Capacity Metrics App
Finally, lets take a quick look at the Fabric Capacity Metrics app. You need to be an admin to install and view the report.
Why is the Fabric capacity app important?
It provides insights into how the capacity is being used.
Monitoring usage patterns helps to identify how to scale resources up and down.
High usage items can be quickly identified
Installing the App
Go into your Fabric Workspace and click on the settings cog at the top right of the screen and select the governance and insights Admin Portal
I am the admin for the Fabric capacity so ensure you know who your Fabric Capacity Admin is
Click on the capacity and get the capacity ID from the URL
You can use the ID for the Capacity Metric App
In the Fabric Workspace. Go to your Power BI experience at the bottom left of the screen
Click on Apps and Get Apps
Search for the Fabric capacity App and Get it Now to install
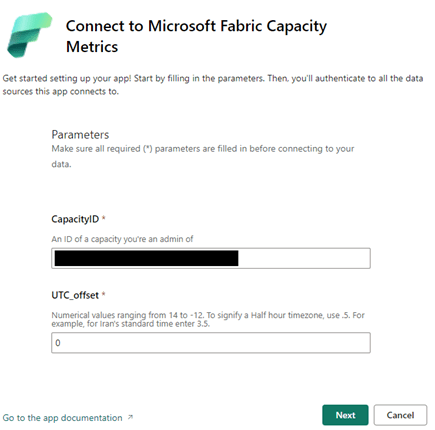
Connect to start working with the app
The screen is where you can use the capacity ID, copied from the Admin Portal. You then need to sign in and connect.
Here is where the Fabric experience falls down for me slightly currently.
The capacity app doesn’t show financial costs (Although part of the license fee. There are still costs to running spark jobs). Also, only the Fabric admin can see this information.
As a none admin user, I still want the power to be able to see my utilisation as I work with fabric.
Conclusion
The more you learn with Fabric the more exciting it gets. The next goals are to work with the Data Warehouse and the real time capabilities.
There are so many opportunities to use the Delta Lake or SQL DW as our transformation (Staging area) with Direct Lake Power BI connection. I can see Delta Lake being the option of choice to quickly to build up smaller solution projects.
As a SQL Developer, I am now a big fan of Pyspark. These two make a great tool set for the Fabric analytics engineer.
And as always with Power BI, there are exciting updates every month to look forward too. You never stop learning as an Analytics Engineer.
As at time of adding this blog. I am working towards the Fabric Engineer Certification after getting my Azure Engineer Associate some time ago. So lots more to think about. My current excitement is the real time analytics within Fabric. I.m really looking forward to trying to implement a project with this.
Any time there is a big change in technology, there is a steep learning curve to go with it. Since Microsoft announced Fabric in May 2023 We have been working hard on getting up to speed with how Fabric works and how it changes the nature of what we do.
What new architectures are available for us to work with?
How it changes working with Power BI?
How we create our staging and reporting data before loading into Power BI?
How Pipelines differ from data Factory, and pipelines in Synapse?
Keeping up with the monthly updates across Fabric
In my previous post “The Microsoft data Journey so far. From SQL Server, Azure to Fabric” I looked at my own journey working with on premises Microsoft services through to Fabric. Along with identifying all the key fabric areas.
This post is about my initial discoveries whilst actively working with Fabric, specifically using the Lake house, and ways of developing your learning within the Microsoft Fabric space.
In Part 1, we explore various topics within the Fabric Data Engineering capabilities. In Part 2, we will delve into Fabric Power BI and semantic modelling resources.
Analytics Engineer
Analytics engineer is a new title to go along with Fabric (SaaS) end to end analytics and data platform. One of the first things to do was to go through Microsoft’s Analytics Engineering learning pathway, with the aim of taking the exam.
I personally took my time with this because I wanted to get as much out of it as possible and passed the exam on the 24th of June 2024. Making me a certified Fabric Analytics Engineer.
Specialises in analytics solutions. Data engineers have a broader focus.
Collaborate closely with Data Engineers, business process knowledge owners. Analysts etc
Transforming data into reusable assets
Implementing best practices like version control and deployment
Works with lakehouses, Data Warehouses, Notebooks, Dataflows, Data pipelines, Semantic models and Reports
Skills in SQL, DAX, Pypark, ETL Tools etc
Analytics Specialist
Focuses on analysing data and data insights to support decision making
Creates reports and Dashboards and communicates findings
Identifies trends and patterns along with anomalies
Collaborates with stakeholders to understand their needs.
Skills in visualisation tools like power BI
As you can see, the Analytics Engineer is a bridge between Data Engineering and Analytics. The Analytics Specialist is sometimes seen as an end to end developer with knowledge across all of these specialties. But has a major focus on analytics solutions.
Architecture
With Fabric, we have numerous architectural options. By making strategic choices, we can eliminate the need for data copies across our architecture. Consider the standard architecture using Azure resources. A Data lake, SQL Database and Data Factory.
Here we have 2 copies of the original data. In the data Lake and the SQL Database (Because you copy the data across to transform, create your dimensions, facts etc).
And finally the same imported dims and facts created in SQL DB are imported and stored in Power BI.
This architecture works well, it allows for data scientists to use the data in the data lake and it allows for SQL Stored procedures to be put in place to process the data into the correct analytical (Star) Schemas for Power BI.
However, wouldn’t it be great if you could remove some of the data copies across the resources.
Fabric leverages the medallion architecture
Bronze layer – Our raw unprocessed data.
Silver – Cleaned and transformed data
Gold Layer – Enriched data optimised for analytics.
Even using Fabric, there are lots of opportunities to use specific resources to change your architecture dependent upon the project. For example, you could decide to use Fabrics next generation Data warehouse, designed for high performance and scalability. Excellent for big data solutions. And allows you to do cross database querying, using multiple data sources without data duplication.
However, at this point I have spent my time looking at how we can utilize the delta lake. Creating an architecture that uses Delta Parquet files. Can this be a viable solution for those projects that don’t have a need for the high level ‘big data’ performance of the Fabric Data Warehouse?
There are significant advantages here, as we are reducing the amount of duplicated data we hold.
And of course, Power BI can use Direct Lake connection, rather than Import mode. Allowing you to remove the imported model entirely from Power BI. Even better, with partitioned Delta Parquet files you can have bigger models, only using the files that you need.
This architecture has been used for some initial project work, and the Pyspark code, within Notebooks, has proved itself to be fast and reliable. As a fabric Engineer I would definitely say that if you are a SQL person its vital that you up your skills to include Pyspark.
However, with some provisos, The Data Warehouse can also utilise Direct Lake mode, so sometimes. Its literally the case of, what language do you prefer to work in. Pyspark or SQL?
Task Flows
The Fabric Task flows are a great Fabric feature, and incredibly helpful when setting up a new project.
You get to visualize your data processes
Create best practice task flows
Classify your tasks into Data Ingestion, Data Storage, Data Preparation etc
Standardise team work and are easy to navigate
Here, the Medallion flow was used, immediately giving us the architecture required to create our resources.
You can either select a previously created task to add to your task flow
Or create a new item. Fabric will recommend objects for the task
One tip from using the medallion task flow. As you can see. Bronze, Silver and Gold Data Lake houses are shown as separate activities. Currently, you can’t create one data lake and add it to each activity.
If you want to use one lake for all three areas, you need to customise the activity flow. As a result, the decision was made to have three delta lake’s working together for the project. But it may not be something you wish to do. So customising the flow may be a better option.
GIT integration
The fabric workspace comes with GIT integration, which offers a lot of benefits. With GIT, you can save your code base to your central repository, allowing for version control. Much better collaboration, better code and peer reviewing. And CI/DC automation.
There are some current issues however, especially with branching, as some branching capabilities are still in preview. For an initial test project a very basic approach was used.
Here, a new Project has been added to Devops: Debbies Training
Visual Studio
Visual Studio was used to clone the repository, but there are lots of other ways you can do this next step, For example GIT Bash.
And connect to the repository that has been created (You need to log in to see your repos)
Click clone and you will then have a local copy of the code base. It doesn’t support everything at the moment but it does support Notebooks, Reports, Semantic Models and Pipelines, which is the focus of our current learning.
Connect Devops to Fabric
Back in the Fabric Workspace go to Workspace Settings
You are now connected to Devops (Note the branch is main)
Later, we want to start using branches when the underlying Fabric logic is better, But for now, we have been using the main branch. Not ideal, but we should see this getting better a little further down the line.
You can now create your resources and be confident that your code is being stored centrally.
All you need to do is publish changes via the Fabric workspace (Source Control)
Click Commit to commit your changes and change Descriptor
Watch out for updates to this functionality. Especially branching
Pyspark and Notebooks
As a SQL developer, I have spent years writing code to create stored procedures to transform data in SQL databases.
SQL, for me is what I think of as my second language. I’m confident with it. Pyspark is fairly new to me. My biggest question was:
Using my SQL knowledge, can I think through a problem and implement that solution with Pyspark.
The answer is, yes.
As with anything. Learning new languages can be a steep learning curve. But there is lots of help out there to grips with the new language. For example, CoPilot has been incredibly useful with ideas and code. But, on the whole, you can apply what you know in SQL and use the same solutions in a Pyspark notebook.
Here are a few Tips
Pyspark, unlike SQL is CASE sensitive so you have to be much more rigorous when writing code in your notebooks.
When working with joins in Pyspark. You can significantly speed up the creation of the new data frame by using Broadcast on the smaller table. Broadcast optimizes the performance of your spark job by reducing data shuffling.
With SQL, you work with temporary tables and CTE’s (common table expressions). Dataframes replace this functionality, but you can still think of them in terms of your temporary tables.
SQL, you load the data into tables, With the Lakehouse, you load your data into files. The most common type is Parquet. It’s worth understanding the difference between Parquet and Delta Parquet. We looked at this in detail in the last blog “The Microsoft data Journey so far. From SQL Server, Azure to Fabric”. But we will look at the practicalities of both, a little later.
Unlike a SQL Stored Procedure where, during development you can leave your development work for a while. Then come back to the same state. The spark session will stop at around 20 minutes so you can’t simply leave it mid notebook. Unless you are happy to run again.
Start your session in your notebook.
Click on session status in the bottom left corner
See the session status in the bottom left corner
Here we can see the timeout period which can be reset.
Delta Parquet
When working with Parquet files. We can either save as Parquet (Saved in the files section of fabric) Or save as Delta Parquet. (Saved in the tables section of Fabric)
Always remember, if you do want to use the SQL Endpoint to run queries over your files, always save as Delta Parquet.
If you want to use the Direct Lake connector to your parquet files for Power BI Semantic Model, again, use Delta Parquet files.
One question was, if you are using a lake house and have the opportunity to create Delta Parquet. Why wouldn’t you save everything with the full Delta components of the parquet file?
There are a few reasons to still go with parquet only.
Parquet is supported across various platforms. If you share across other systems this may be the best choice.
Parquet is simple, without the ACID transaction features. This may be sufficient.
Plain parquet files can offer better performance.
Parquet files are highly efficient for storage, as they don’t have the delta parquet overheads. A good choice for archiving data.
With this in mind. Our project has followed the following logic for file creation
Dims and Facts
Always use Delta Parquet for full ACID functionality and Direct Lake connectivity to Power BI.
Audit Tables
We always keep track of our loads. When the load took place? What file was loaded? How many records? etc. Again, these are held as Delta Parquet. We can use the SQL endpoint if we want to quickly analyse the data. We can also use the Direct Lake connector for Power BI to publish the results to a report.
Even better. Our audit reports contain an issue flag. We create the logic in the Pyspark Notebook to check if there are issues. And if the flag is 1 (Yes) Power BI can immediately notify someone that there may be a problem with the data using Alerts.
Staging tables
A lot of the basic changes are held in transformed tables. We may join lots of tables together. Rename columns. Add calculated columns etc. Before loading to dims and facts. Staging tables are held as Parquet only. Basically, we only use the staging tables to load dim and fact tables. No need for the Delta overheads.
Pipelines
When you create your notebooks, Just like SQL stored Procedures, you need a way of orchestrating their runs. This is where Data Factory came in working with Azure. Now we have Pipelines in Fabric, based on the pipelines from Azure Synapse.
I have used Data factory (and its predecessor Integration Services) for many years and have worked with API’s. The copy activity. Data Mappings etc. What I haven’t used before is the Notebook activity.
There are 5 notebooks, which need to be run consecutively.
Iterate through Each Notebook
When creating pipelines, The aim is to reuse activities and objects. So, rather than having 5 activities in the pipeline. One for every notebook. We want to use 1 activity that will process all the notebooks.
In the first instance. We aren’t going to add series 5 into the Data Lake.
Create a csv file
Also get the IDs of the workspace and the notebooks. These were taken from the Fabric url’s. e.g.
The file is added into the bronze delta lake
Now we should be able to use this information in the pipeline
Create a lookup
In the pipeline we need a Lookup activity to get the information from the JSON file
Add a ForEach Activity
Drag and drop a ForEach activity onto your pipeline canvas and create an On Success Relationship between this and the Lookup.
Sequential is ticked because there are multiple rows for each notebook and we want to move through them sequentially.
Set the ‘Items’ in Settings by clicking to get to the pipeline expression builder
We are using the output.value of our lookup activity.
@activity(‘GetNotebookNames’).output.value
Configure the Notebook Activity Inside ForEach
Inside the Foreach. Add a Notebook activity
Again, click to use the Dynamic content expression builder to build
Workspace ID: @item().workspaceID
Notebook ID: @item().notebookID
Note, when you first set this up you see Workspace and Notebook Name. It changes to ID, I think this is because we are using the item() but it can be confusing.
This is the reason ID has been added into the csv file. But we still wanted the names in the file in order to better understand what is going on for error handling and testing.
@item(): This refers to the current item in the iteration which is a row. When you’re looping through a collection of items, @item() represents each individual item as the loop progresses.
.notebookID: This accesses the notebookID property of the current item. And the notebookID is a column in the csv file
Running the pipeline
You can check the inputs and outputs of each activity.
If it fails you can also click on the failure icon.
The above information can help you to create a simple pipeline that iterates through Notebooks.
There are other things to think about:
What happens if anything fails in the pipeline?
Can we audit the Pipeline Processes and collect information along the way?
Within the Notebooks, there is Pyspark code that creates auditing Delta Parquet files which contain information like: Date of Load, Number of rows, Name of activity etc. But you can also get Pipeline specific information that can also be recorded.
Currently this Pipeline can be run and it will process either 1 file or multiple files dependant upon what is added to the bronze lakehouse. The Pyspark can deal with either the very first load or subsequent loads.
With this in place, we can move forward to the Semantic Model and Power BI reporting
Conclusion
Most of the time so far has been spent learning how to use Pyspark Code to create Notebooks and our Delta Parquet files. There is so much more to do here, Data Warehousing, Delta parquet file partitioning. Real time data loading, Setting up off line development for code creation etc.
The more you learn, the more questions you have. But for the time being we are going to head off and see what we can do with our transformed data in Power BI.
In the Part 2, we will look at everything related to Power BI in Fabric.
Having lived and breathed Microsoft for over 20 years, it is important to sometimes stop and think about all the changes over those years and all the growth and learning gained from each change to the analytics space.
I started working with on premises Microsoft Products. We had a large room full of Microsoft 2000 servers and a long journey to finally upgrade to 2008 R2.
Integration Services was the orchestration tool of choice and Reporting services (SSRS) was the server based reporting tool.
We were starting to move from basic management reporting into business intelligence, especially with the introduction of SQL Server Analysis Services that became part of the environment when we finally pushed to 2008 R2.
We have come along way since those days.
On Premises Analytics
One of the biggest issues with On Premises was the upgrading to new Servers. We had a lot of servers and applications tied to those servers. Upgrading to the latest release was never easy and sometimes couldn’t be done because of the system it supported.
This led to a real disparity of servers. Some still at 2000. Some 2008 R2. A few lucky ones moving to later versions.
Another big issue specially for the analytics team was the use of the servers. Spinning up a new database needed a lot of work to make sure that whatever was required wouldn’t run out of space or memory. Because there was only a certain amount of these resources for all services.
There were examples of simply not being able to work on a project because of these restrictions.
There is nothing more frustrating as a developer to know there are later releases out there but you are stuck on an old version. Or knowing that you could do so much more with a bit more compute power or space allocation. There was no room to grow. You had to understand your full limit and work from there.
Reporting Services (SSRS)
Its interesting to look back on SSRS, Microsoft’s Paginated reporting original solution after using Power BI for so long now.
Yes it delivered fairly basic paginated reporting but it didn’t quite deliver the experience we really wanted to go with for our new Business Intelligence vision.
On Premises to Azure
A career move presented me with the opportunity to start using Azure and Power BI.
Finally, the floodgates seemed to open and new possibilities seemed to be endless. Here are just a few examples of the changes happening at this point
Azure allowing us to always be on the latest version. No more wishing that you could use SQL Server 2014 whilst stuck on 2008 R2.
Power Bi, interactive data visualisation. The complete gamechanger. We will look at that more later
Azure SQL Databases. Here we can now spin up small cheap solutions for development work. Scaling up as we go. Never needing to pay for more than we use. Even having the advantages of upping compute during peak loading times. Always being on the latest version, and so many possibilities of choice.
Serverless SQL DB for example. Great for Dev and UAT. Only unpausing compute resources when you need them.
We can still work with our SQL Skills building stored procedures to transform data.
Azure Data Lake. Secure Cloud storage for structured and unstructured data. A landing area for our data that also creates opportunities for our Data Science experts.
Azure Data Warehouse (Which upgraded to Synapse in 2019) was the offering that allows for MPP Massively parallel processing for big scale data. Along with the serverless SQL Pools (Synapse) to finally give us the chance to do analysis and transformations on the data pre the SQL Database load.
Data Factory. The Azure Data Orchestration tool. Another big gamechanger, offering so much more flexibility than Integration Services. Having a solution that can access Cloud resources and on premises resources. So much connectivity.
Power BI
Power BI is Microsoft’s modern analytics platform that gives the user the opportunity to shape their own data experience.
To drill through to new detail.
Drill down into hierarchies.
Filter data.
Use AI visuals to gain more insight.
Better visuals
And at the heart of everything. The Power BI Tabular storage model. The Vertipaq engine, Creating reporting that can span over multiple users all interacting with these report pages. Each user sending queries to the engine at speed.
I have worked with Analysis Services in the past, along with SSRS. Creating Star Schemas sat in columnar storage without needing to set up Analysis Services was a huge win for me as it was a much easier process.
Of course, you can’t talk about Power BI without understanding how different each license experience is. From the Power BI Pro Self Service environment, through to Power BI Premium Enterprise Level License.
There has been a lot of changes and Premium continues to create fantastic additional functionality. Premium sits on top of the Gen 2 Capacity offering larger model sizes. More compute. Etc.
As a take away. When working with Pro, you should always work with additional Azure resources, like Azure SQL DB, Integration Services etc to get the best end product.
With Azure and Power BI we have worked with the recommended architectures and produced quality analytics services time and time again. But, there were still some issues and pain points along the way.
And this is where Fabric comes in.
Fabric
Fabric is the (SaaS) Software as a Service Solution, pulling together all the resources needed for analytics, data science and real time reporting. Fabric concentrates on these key areas to provide an all in one solution.
On the whole, for an analytics project, working with customers, our (basic) architecture for analytics projects was as follows:
Extract data into a Data Lake using Integration Services on a Schedule
Load the data into SQL Server Database
Transform the data into STAR schema (Facts and Dimensions) for Power BI analytics
Load the data into Power BI (Import mode where ever possible. But obviously there are opportunities for Direct Query, and Composite modelling for larger data sets)
We can see here that the data is held in multiple areas.
Synapse starts to address this with the Serverless SQL Pools. We can now create Notebooks of code to transform our data on the file itself. Rather than in the SQL Database on the fully structured data.
Fabric has completely changed the game. Lets look into how in a little more detail.
Medallion architecture
First of all, we need to understand the architectures we are working with. The medallion architecture gives us specific layers
Gold – Our landing area. The data is added to the lake. As is. No Processing
Silver – The Data is transformed and Processed
Gold – the data is structured in a way that can be used for Analytics. The Star schema for Power BI.
Fabric allows us to work with the medallion architecture seamlessly. And as announced at Microsoft build in May of this year. We now have Task Flows to organise and relate resources. The Medallion architecture is one of the Flows that you can immediately spin up to use.
Delta Lake
The Delta lake enhances Data Lake performance by providing ACID transactional processes.
A – Atomicity, transactions either succeed or fail completely.
C – Consistency, Ensuring that data remains valid during reads and writes
I – Isolation, running transactions don’t interfere with each other
D – Durability, committed changes are permanent. Uses cloud storage for files and transaction logs
Delta Lake is the perfect storage for our Parquet files.
Notebooks
Used to develop Apache Spark jobs so we can now utilise code such as Pyspark and transform the data before adding into a new file ready to load.
Delta Parquet
Here is where it gets really interesting. In the past our data has been held as CSV’s, txt etc. Now we can add in Parquet files into our architecture.
Parquet is an open source, columnar storage file format.
The Power BI data model is also a columnar data store. This creates really exciting opportunities to work with larger models and have the full suite of Power BI DAX and functionality available to us.
But Fabric also allows us to create our Parquet Files as Delta Parquet, adhering to the ACID guarantees.
The Delta is and additional layer over Parquet that allows us to do such things as time travel with the transaction log. We can hold versions of the data and run VACUUM to remove old historical files not required anymore.
Direct Lake Mode
Along with Parquet we get a new Power BI Import mode to work with. Direct Lake allows us to connect directly to Delta Parquet Files and use this columnar data store instead of the Power BI Import mode columnar model.
This gives us a few advantages:
Removes an extra layer of data
Our data can be partitioned into multiple files. And Power BI can use certain partitions. Meaning we can have a much bigger model.
Direct Query, running on top of a SQL DB is only as quick as the SQL DB. And you can’t use some of the best Power BI Capabilities like DAX Time Intelligence. With Direct Lake you get all the functionality of an Import model.
SQL Analytics Endpoints
If you are a SQL obsessive, like myself you can analyse the data using the SQL analytics endpoint within a file. No need to process into a structured SQL Database
Data Warehouse
Another one for SQL obsessives and for Big Data reporting needs. There will be times when you still want to serve via a structured Data Warehouse.
Conclusion
Obviously this is just a very brief introduction to Fabric and there is so much more to understand and work with. However using the Medallion architecture we can see a really substantial change in the amount of data layers we have to work with.
And the less we have of data copies, the better our architecture will be. There are still a lot of uses for the Data Warehouse but for many smaller projects, this offers us so much more.
Its been a long journey and knowing Microsoft, there will be plenty more fantastic new updates coming. Along the way, I would say that these three ‘jumps’ were the biggest game changes for me, and I can’t wait to see what Fabric can offer.