SQL Analytics Endpoint
Lets switch to the SQL analytics endpoint
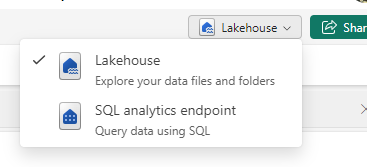

Only the Delta table are available with the SQL endpoint.
Lets try some options
New SQL Query
We can use SQL to check that we are happy with what has been created
SELECT e.Series, e.EpisodeName,t.Task, t.TaskType, c.ContestantName, f.Points
FROM [DebbiesFabricLakehouse].[dbo].[facttaskmaster] f
inner join [DebbiesFabricLakehouse].[dbo].[dimepisode] e on f.EpisodeKey = e.EpisodeKey
inner join [DebbiesFabricLakehouse].[dbo].[dimtask] t on t.TaskKey = f.TaskKey
inner join [DebbiesFabricLakehouse].[dbo].[dimcontestant] c ON c.ContestantKey = f.ContestantKey
Where e.EpisodeName = 'The poet and the egg'
Order by t.Task
Immediately we can spot some problems.
Task 1 has 10 records and not 5. there should always be 5.
We can write a query to see how many issues there are

With CTEtm (Series, EpisodeName,Task, TaskType, ContestantName, Points)

AS
(SELECT e.Series, e.EpisodeName,t.Task, t.TaskType, c.ContestantName, f.Points
FROM [DebbiesFabricLakehouse].[dbo].[facttaskmaster] f
inner join [DebbiesFabricLakehouse].[dbo].[dimepisode] e on f.EpisodeKey = e.EpisodeKey
inner join [DebbiesFabricLakehouse].[dbo].[dimtask] t on t.TaskKey = f.TaskKey
inner join [DebbiesFabricLakehouse].[dbo].[dimcontestant] c ON c.ContestantKey = f.ContestantKey)

SELECT Series, EpisodeName, Task, count(*) AS TotalRows
FROM CTEtm
GROUP BY Series, EpisodeName, Task
Having COUNT(*)>5
There are 146 issues.

You cant manipulate the data with UPDATE’s inserts etc.
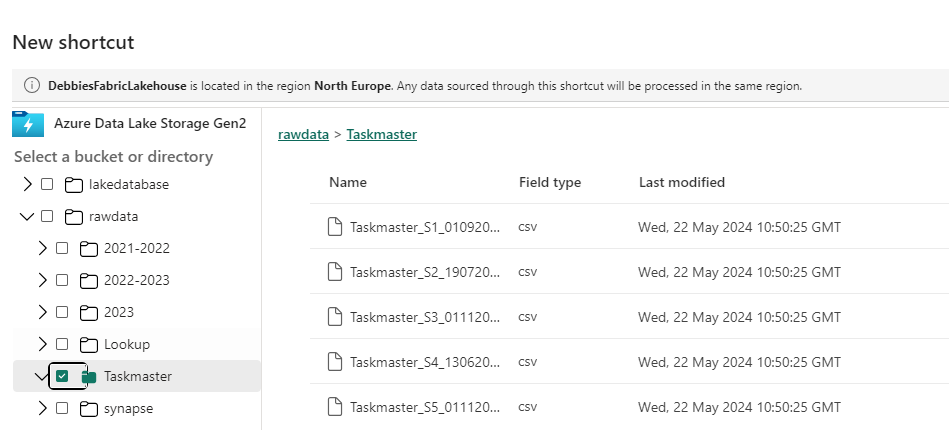
New Visual Query
lets try and get an issue example using a visual query

Before merging with the contestant, the contestant needed to be dragged into the analytics pane.
This is very similar to the power Query Editor and could be of use to people who aren’t as proficient in SQL and prefer using visual tools
Personally I prefer SQL. So I will stick to this.
Back in SQL Query
SELECT e.Series, e.EpisodeName,t.Task, t.TaskType, c.ContestantName, f.Points
FROM [DebbiesFabricLakehouse].[dbo].[facttaskmaster] f
inner join [DebbiesFabricLakehouse].[dbo].[dimepisode] e on f.EpisodeKey = e.EpisodeKey
inner join [DebbiesFabricLakehouse].[dbo].[dimtask] t on t.TaskKey = f.TaskKey
inner join [DebbiesFabricLakehouse].[dbo].[dimcontestant] c ON c.ContestantKey = f.ContestantKey
Where e.Series = 'S1'
AND t.Task = 'Buy a gift for the Taskmaster'
Order by c.ContestantName
Clearly we have an issue with Dim Contestant. We have two of every contestant. This has been super useful. We cant resolve in SQL so its time to go back to the contestant notebook.
The SQL code is going to be kept here in Queries

You can also moved to Shared Queries to other developers can access your queries.
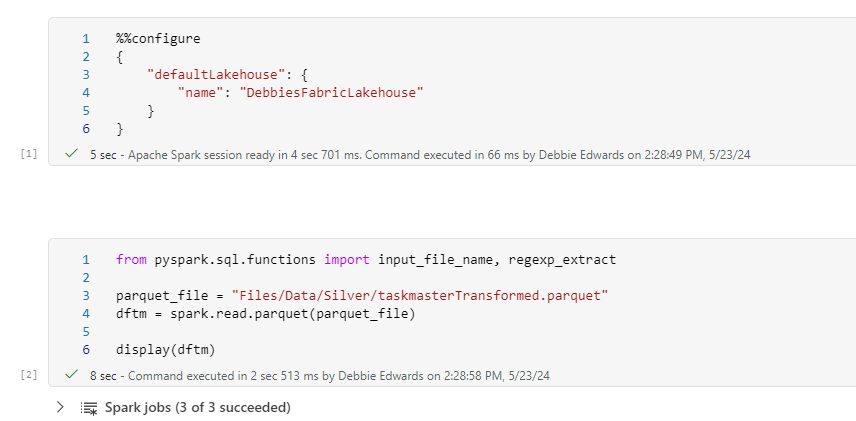
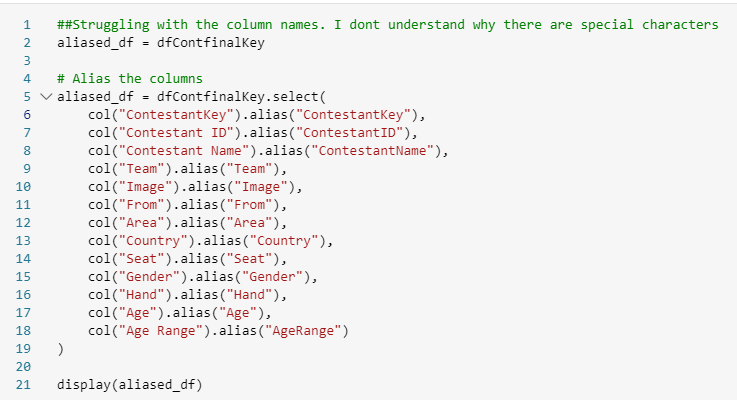
Back in the Contestants V2 Notebook
We have an issue in the Contestants Dim.
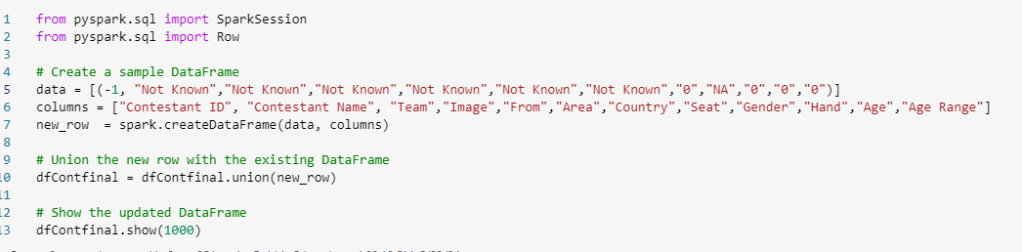
After we drop the records where Team is null we now need to add additional Pyspark to check for Duplicates
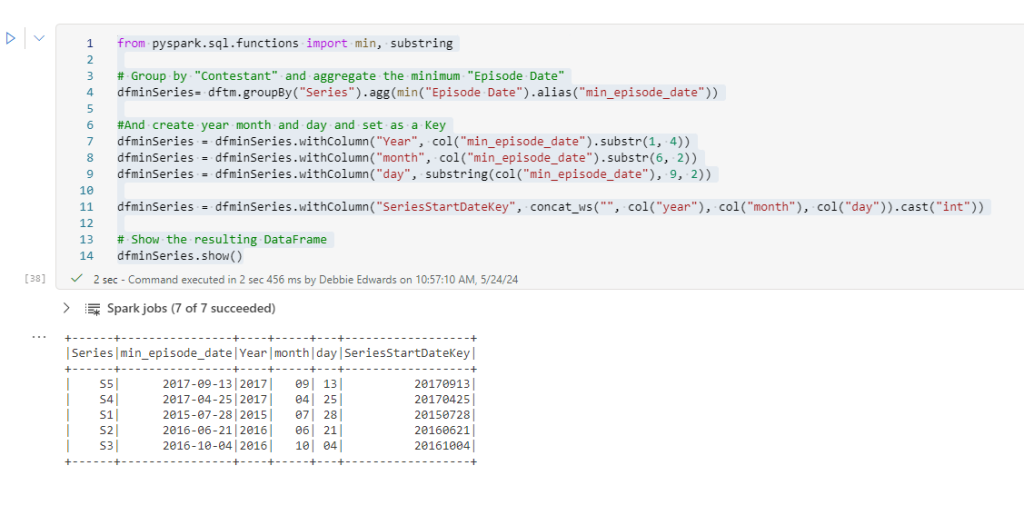
from pyspark.sql.functions import min, substring

# Group by "Contestant" and aggregate the minimum "Episode Date"
dfContfinalGrp = dfContfinal.groupBy("Contestant Name").count()
dfContfinalGrp = dfContfinalGrp.filter(col("count") > 1)

# Show the resulting DataFrame
dfContfinalGrp.show()

These will cause issues. Why is it happening?
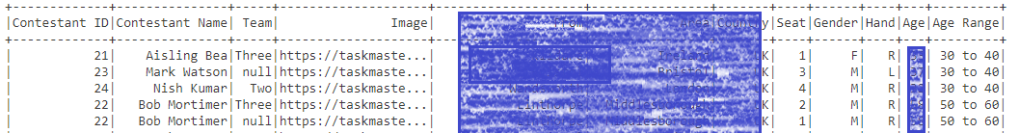
filter_column = dfContfinal.filter(col("Contestant Name") == "Noel Fielding")

# Show the resulting DataFrame
filter_column.show()
Its seat causing the issues because these contestants have been on Taskmaster more than once.
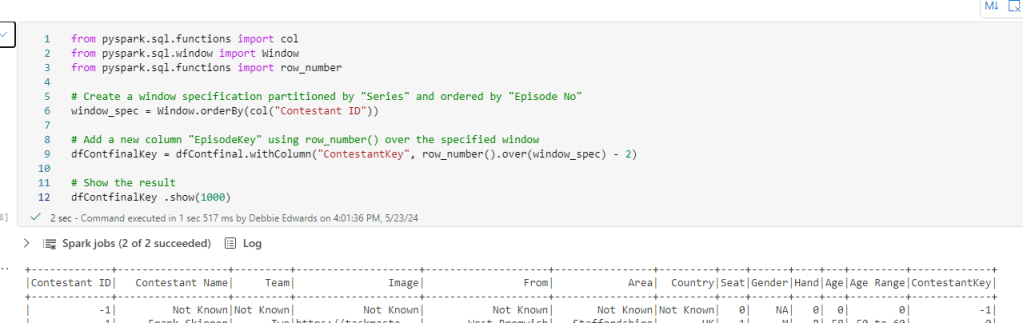
This causes us an issue. This is fine, Because the granularity is the contestant and seat. We need to update the Fact table key accordingly. And it goes even further than this. What we really need to do is go back to the original transformation notebook to ensure we can join on Seat
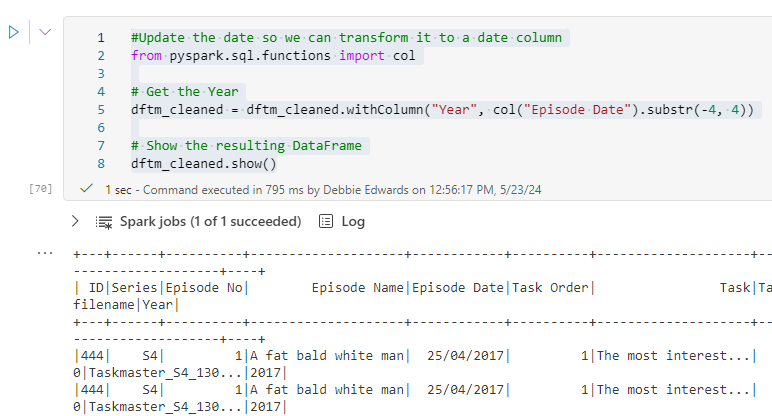
Back to the Transformation Notebook
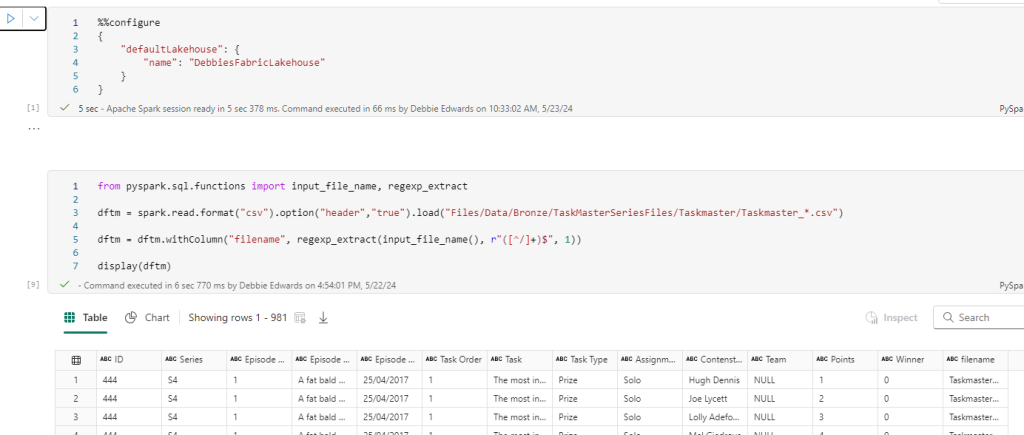
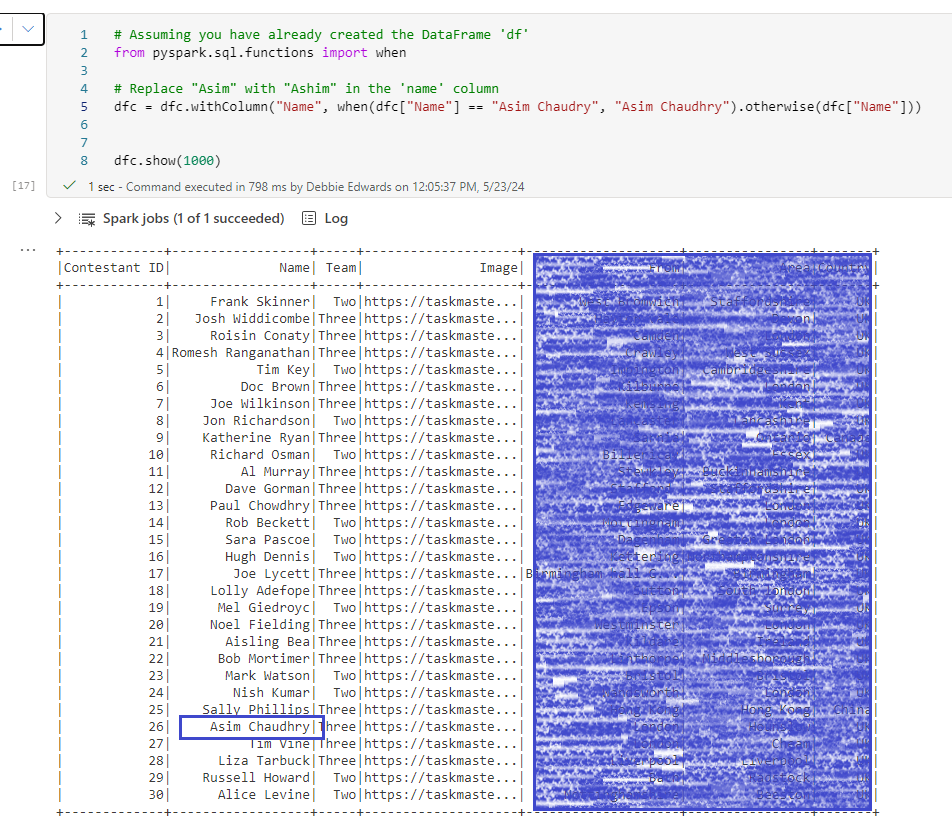
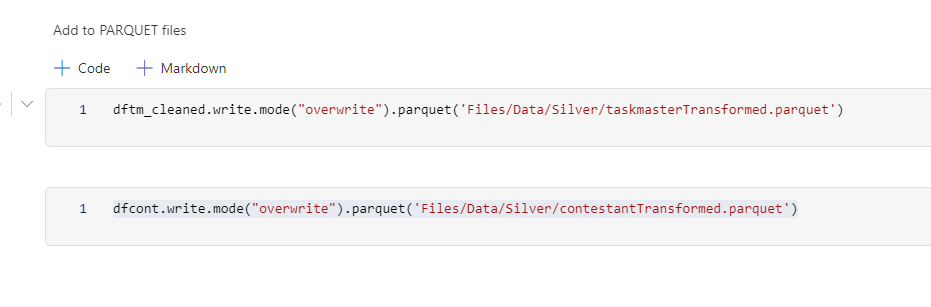
There is a query that merges Contestants and people together.
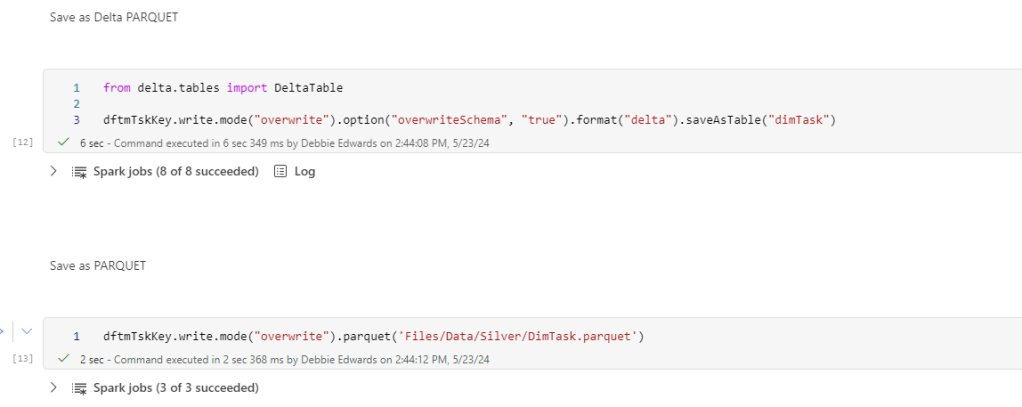
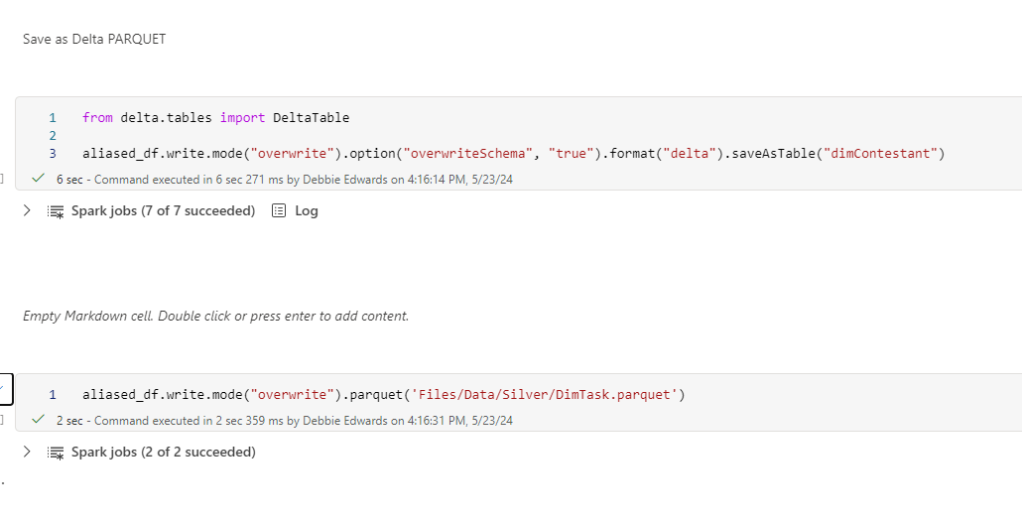
Instead of loosing this information. We need to load it into PARQUET for use later and we need to keep series in this dataframe
One tweak is to keep the series in the transformed contestant PARQUET file and then make sure it matches S1 S2 etc in the main file
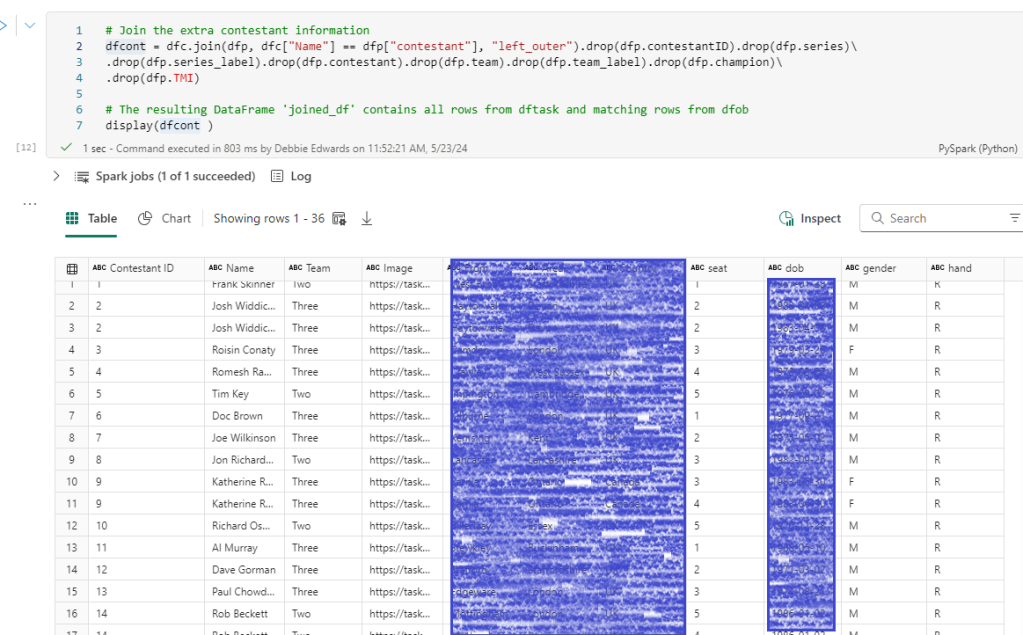
# Join the extra contestant information
dfcont = dfc.join(dfp, dfc[“Name”] == dfp[“contestant”], “left_outer”).drop(dfp.contestantID)\
.drop(dfp.contestant).drop(dfp.team).drop(dfp.team_label).drop(dfp.champion)\
.drop(dfp.TMI)
# The resulting DataFrame ‘joined_df’ contains all rows from dftask and matching rows from dfob
display(dfcont)
series has been removed from .drop()
Create S1 instead of Series 1 etc in the transformed contestant file.
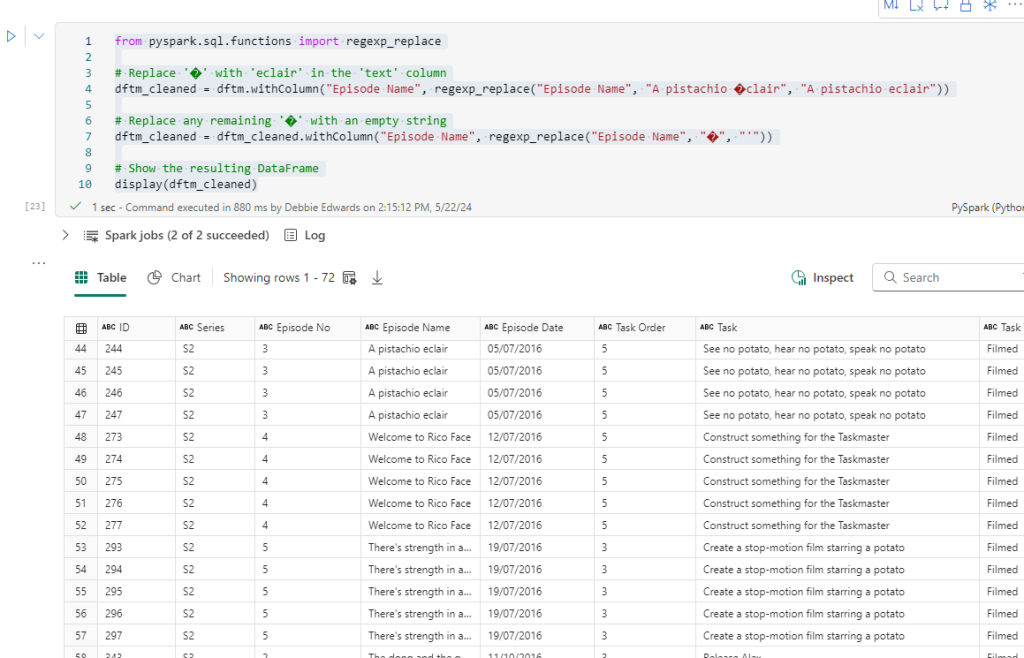
from pyspark.sql.functions import regexp_replace

# Assuming you have a PySpark DataFrame named dfcont
dfcont = dfcont.withColumn("series_label", regexp_replace("series_label", "Series ", "S"))

# Show the updated DataFrame
dfcont.show()
Back to the Fact Notebook
change to the code when adding in the contestant key
Before we continue. We want to add the seat into the main tm dataframe
#Join tm to contestants to get the seat
dftm = dftm.join(drctrans, (dftm["Contestant"] == drctrans["Name"])& (dftm["Series"] == drctrans["series_label"]), "left_outer")\
.drop(drctrans.Name).drop(drctrans.Image).drop(drctrans.From).drop(drctrans.Area).drop(drctrans.Country).drop(drctrans.series).drop(drctrans.series_label)\
.drop(drctrans.dob).drop(drctrans.gender)\
.drop(drctrans.hand).drop(drctrans.age).drop(drctrans.age_decimal).drop(drctrans.ageRange)

# The resulting DataFrame 'joined_df' contains all rows from dftask and matching rows from dfob
display(dftm)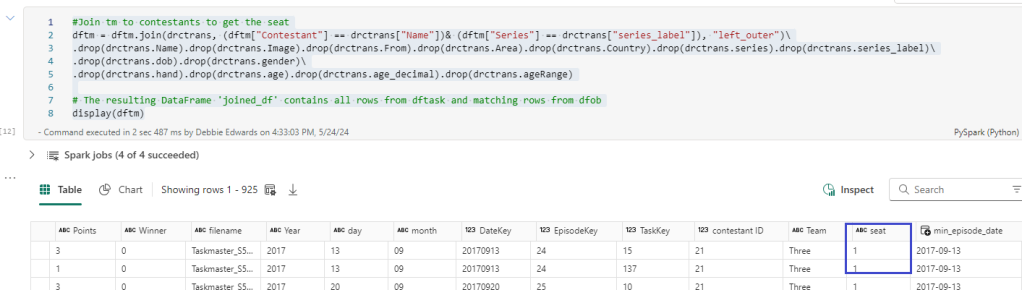
Here we add in seat from the transformed contestant data
#We want the seat in the main table
dftm = dftm.join(dfc, (dftm["Contestant"] == dfc["ContestantName"])& (dftm["Seat"] ==dfc["Seat"]), "left_outer")\
.drop(dfc.ContestantID).drop(dfc.ContestantName).drop(dfc.Team).drop(dfc.Image).drop(dfc.From).drop(dfc.Area).drop(dfc.Country).drop(dfc.Seat).drop(dfc.Gender)\
.drop(dfc.Hand).drop(dfc.Age).drop(dfc.AgeRange)

# The resulting DataFrame 'joined_df' contains all rows from dftask and matching rows from dfob
display(dftm)
And updated the above code to also join on Seat now we have seat in both the main table and the dim table to get the correct Key.
Back in the SQL endpoint
SELECT e.Series, e.EpisodeName,t.Task, t.TaskType, c.ContestantName, f.Points
FROM [DebbiesFabricLakehouse].[dbo].[facttaskmaster] f
inner join [DebbiesFabricLakehouse].[dbo].[dimepisode] e on f.EpisodeKey = e.EpisodeKey
inner join [DebbiesFabricLakehouse].[dbo].[dimtask] t on t.TaskKey = f.TaskKey
inner join [DebbiesFabricLakehouse].[dbo].[dimcontestant] c ON c.ContestantKey = f.ContestantKey
Where e.Series = 'S1'
AND t.Task = 'Buy a gift for the Taskmaster'
Order by c.ContestantName

The fixes have removed a lot of issues but we are still left with 6 episodes causing issues. like the one above.
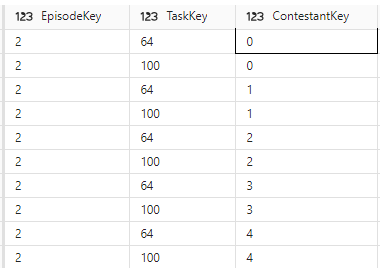
looking at the keys. its clearly the task key.
SELECT * FROM [DebbiesFabricLakehouse].[dbo].[dimtask] Where TaskKey IN (64,100)
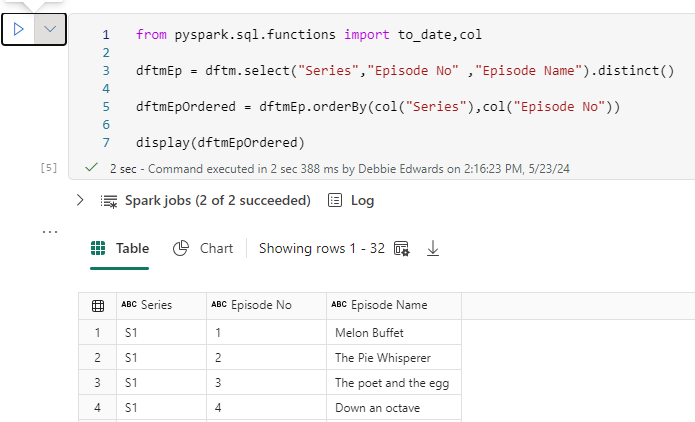
Back to the Episodes Notebook Attempt 2
The really good thing about the SQL Endpoint is that I can quickly check the work that has been done for issues like this before moving onto the semantic model
Now this issue is highly probable because some tasks across series may have the same Task Name. And its the order that gives it its uniqueness in the dimension

Again, we go back to the fact dataframe to add TaskOrder into the join

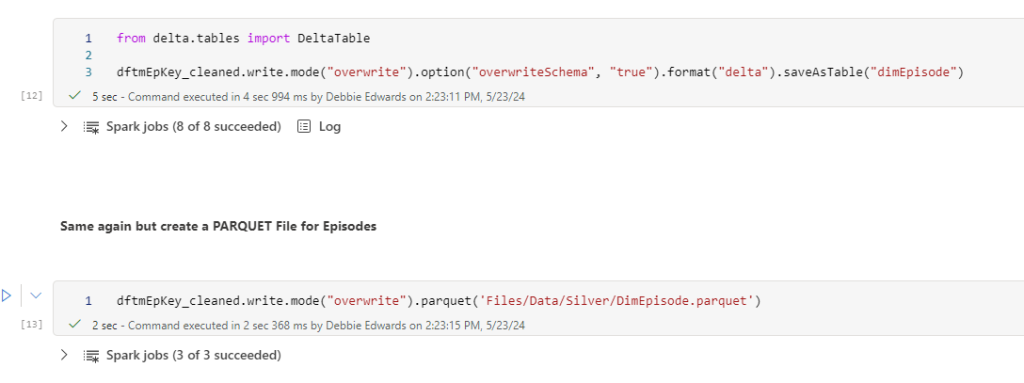
Back to the Episodes Notebook Attempt 3
Lets see how this fix has helped

Conclusion
The SQL endpoint has helped us fix
- Contestants where a contestant has been on more than one series
- Tasks, when a task has the same name
as a developer with a lot of experience in SQL this is a really great way of quickly creating code to check for errors. And you have the graphical functionality if you aren’t a SQL person.
I’ts a real win.
Next. We have our star schema and its been tested. Time to create the Semantic Model.