After 14 years using Microsoft On Premise BI Tools (SQL Server, Reporting Services, Integration Services and Analysis Services) Its time to embrace Business Intelligence in the cloud.
How do you do schema changes to your model without refreshing the entire model?
This is especially applicable for large models using incremental refresh where refreshing the entire data set takes a long time to process.
The ALM toolkit really helps with this process
The examples I am going to use aren’t incremental refresh but it will hopefully give some idea on how to use the ALM toolkit
And a big proviso here. You can only do this with Premium workspaces
Source
Open your model in Power BI desktop. From here go to External tools and open the ALM Toolkit (Ensure you have the latest version of the AML toolkit downloaded)
The source has already been populated against the open model. We now need to set the target
Target
Go to the service. Workspace Settings.
At this point the workspace needs to be in Premium
You need to copy the workspace Connection which is only available in Premium. Once copied, add into Workspace
We can see that the pbix file and the data set in service are identical. ‘Same Definition‘
Lets make some changes
Adding a new measure
add a new measure in your desktp pbix dataset.
Total Product Standard Cost = SUM(FactResellerSales[ProductStandardCost])
And back to ALM toolkit.
Before continuing, go into Options
Make sure that the Processing Option is default and that we are only going to process affected tables
For table updates, retain partitions should be checked, This is very specific to Power BI Incremental loading. Incremental loading works with partitions and we don’t want ALM toolkit to go to the database and affect any of the partitions ‘For example you could have a partition for every year’
Click Compare
And then Select Actions
Hide Skip objects will get rid of everything that hasn’t changed.
Now we can see the one new measure
We want to add the new measure without completely refreshing the data set
Then go to Update
Are you sure? message is returned
Quick note on XMLA Endpoints
At this point you need to have Read Write enabled on the XMLA endpoint
“XMLA endpoints enable open-platform connectivity to Power BI datasets. With these capabilities, customers can leverage a single one-version-of-the-truth semantic model across a range of data-visualization tools”
To do this you need to be the Power BI Admin or global Admin. In Admin Portal > Capacity settings > Workloads > XMLA Endpoint = read Write
If the next step doesn’t work you may need to speak to your Admin about the above. this is because we are using an external tool to update the schema.
When I tried this, I didn’t notice errors but the changes started to add up as I went along the process.
Back to the Update
Click OK to are you sure? and the measure is quickly updated. the database wasn’t read or updated. All that happened was a quick schema update.
Why would you want to run an upload, full or Incremental for new measures? this is the perfect way of introducing those new measures as quickly as possible.
Adding a calculated Column
Adding calculated columns aren’t advised because they don’t get compressed in the tabular database, Its always worth doing this in Power Query Editor or ideally in your source reporting database.
Back in the desktop file
A simple calculated column is created.
In ALM toolkit go back to Options
Again, the following options should be set
Then go to Compare. Select Actions and Hide Skipped Objects
And here is the new calculated Column.
Next click Validate Selection
If we were working with Incremental refresh and partitions you would see all your partitions here along with the above information.
If you have these partitions when you update you will see a process message, but don’t worry, it hasn’t done any data processing at the source, its simply added the new column and processed only within the model.
You can go into Power BI Service and do a quick Edit on a report,
drag the new column in to see that there is data for that column, but nothing else has been processed.
Adding new tables or new columns at source or in Power Query Editor
In this case we actually need the data to process.
The measure just needed the DAX to be added to the model.
The calculated column simply used the data already within the data model without doing a process.
For this new logic we do need to process the data.
Back in the ALM toolkit you need to untick, for table updates retain partitions because we now need to pull the data in for all the partitions and process all that data.
Process only affected tables is an important option here, We don’t want to process anything but the new table or column.
Once you have the settings set above you can go on to validate and update. And importantly this time the new data will be processed into the model, rather than just a schema change.
And every partition will be processed on an incremental load because of the change to the settings.
This is an excellent way of dealing with updates on large models but its important to note
Only available for Premium
Ensure Admin Settings – Read Write enabled on the XMLA endpoint
The analysis is performed at the record level of the ‘table’ A field in explain by is not on the ” table or a table from the same data source and related to it by a many to one relationship. Try Summarising it
This model is all about behaviour and attitudes for an event company who put on IT events for companies who want to learn more about cloud based solutions.
The stakeholders are all the people who go on the courses, and those people who arrange the courses.
Its important for the company to know how their customers are reacting to their cloud based events and training. Which ones are doing well or not in terms of reactions.
The trainer or presenter sends out a questionnaire after ever event / course. they also send in their own questionnaire about how they felt the course was engaged with.
I have a Star Schema and in one of the dimensions I have a behaviours table. We want to know what influences behaviour from all the other attributes from around the star schema
There can only be a certain number of behaviour types so this dimension is set as a junk dimension. Each Type of behaviour is joined to the other using a cartesian Join
Every behaviour type is matched to every other behaviour type and then we can simply assign the correct row to the person event and theme
So a stakeholder can go to many events
A stakeholder can hold different behaviours for every event
We want to see what effects behaviour, so the Key Influences visual is the one we really want to use in this project
In this visual we are analysing by Explain by.
Add in a measure from the fact table and it works fine
But this isn’t telling us anything. We need descriptive information from the other dimensions
So lets go for something from Events
And here is where we get the error
The analysis is performed at the record level of the ‘table’
Obviously this part of the error makes sense because we want to understand the behaviour
A field in explain by is not on the ” table
That is correct. we are explaining by a field in another dimension
or a table from the same data source and related to it by a many to one relationship.
Try Summarising it
How to deal with this issue
the error doesn’t give much away but the solution lies in the model.
The recommended single direction join has been used on every single relationship. Therefore, the dimension can filter the fact but the fact cant filter the dimension.
And specific to this model, Another dimension cant filter another dimension
Events and behaviour cant filter eachother.
Unfortunately setting all the relationships to both didn’t resolve the issue either. Maybe the answer lies with DAX
Lets look at that error again
the Keyword in the error is SUMMARISE.
Now we know exactly what we want to use as the ‘Explain by’ Lets see if we can set up a Summary table using DAX
Power BI Pipelines are a Premium Service which allows you to set up a development, QA and Production workspace and easily send your development changes across to the workspaces.
Each workspace can also be configured to work with different data sources. for example, your Dev Power BI may sit on top of test data, rather than the production data.
Because this is only available in Premium, we wanted to look into how difficult this process is outside of the Premium capacity.
Setting up the Development database
I wanted a poc development database for Power BI to work with. I’ve chosen household pets, with a bit of a surprise in Production.
CREATE TABLE [dim].[Pet](
[PetKey] [int] IDENTITY(1,1) NOT NULL,
[PetDescription] varchar NULL
) ON [PRIMARY]
;
CREATE TABLE [fact].[Petmetrics](
[AreaKey] [int] NOT NULL,
[PetKey] [int] NULL,
[PopulationwithPetsPerct] [int] NOT NULL,
[HouseholdswithPets000s] [int] NOT NULL,
[Petsperhousehold] [numeric](2, 1) NOT NULL,
[Petsperregion000s] [int] NOT NULL
) ON [PRIMARY]
;
Insert into dim.Area (AreaDescription)
SELECT 'North East' UNION
SELECT 'North West'UNION
SELECT 'Yorks and Humb'UNION
SELECT 'East Midlands' UNION
SELECT 'West Midlands' UNION
SELECT 'East'UNION
SELECT 'London' UNION
SELECT 'South East' UNION
SELECT 'South West' UNION
SELECT 'Wales' UNION
SELECT 'Scotland' UNION
SELECT 'Northern Ireland' UNION
SELECT 'UK' ;
Insert into dim.Pet (PetDescription)
SELECT 'cat' UNION
SELECT 'Dog';
WITH CTE_DOGS (AreaDescr, PopulationwithPetsPerct,HouseholdswithPets000s,Petsperhousehold,Petsperregion000s)
AS
(SELECT 'North East', 33 , 425, 1.3, 544 UNION
SELECT 'North West', 27, 825, 1.3, 1053 UNION
SELECT 'Yorks and Humb', 22, 545, 1.4, 773 UNION
SELECT 'East Midlands', 31, 750, 1.5, 1111 UNION
SELECT 'West Midlands', 28, 635, 1.3, 803 UNION
SELECT 'East', 21, 585, 1.4, 810 UNION
SELECT 'London', 92, 312, 1.1, 340 UNION
SELECT 'South East', 25, 950, 1.4, 1320 UNION
SELECT 'South West', 28, 674, 1.4, 940 UNION
SELECT 'Wales', 30, 460, 1.4, 647 UNION
SELECT 'Scotland', 23, 547, 1.5, 820 UNION
SELECT 'Northern Ireland', 40, 302, 1.4, 430 UNION
SELECT 'UK', 26, 6604, 1.4, 9000 )
INSERT INTO [fact].Petmetrics
SELECT a.AreaKey, (SELECT PetKey FROM dim.Pet Where PetDescription = 'Dog') AS PetKey,
d.PopulationwithPetsPerct,d.HouseholdswithPets000s,d.Petsperhousehold,d.Petsperregion000s
FROM CTE_DOGS d
INNER JOIN dim.Area a ON d.AreaDescr = AreaDescription
WITH CTE_CATS (AreaDescr, PopulationwithPetsPerct,HouseholdswithPets000s,Petsperhousehold,Petsperregion000s)
AS
(SELECT 'North East', 14, 195, 1.5, 286 UNION
SELECT 'North West', 16, 520, 1.6, 795 UNION
SELECT 'Yorks and Humb', 19, 443, 1.6, 680 UNION
SELECT 'East Midlands', 20, 480, 1.8, 854 UNION
SELECT 'West Midlands', 17, 400, 1.7, 662 UNION
SELECT 'East', 20, 512, 1.8, 876 UNION
SELECT 'London', 14, 428, 1.5, 580 UNION
SELECT 'South East', 20, 890, 1.8, 1422 UNION
SELECT 'South West', 21, 514, 1.6, 810 UNION
SELECT 'Wales', 22, 360, 1.7, 596 UNION
SELECT 'Scotland', 15, 381, 1.6, 590 UNION
SELECT 'Northern Ireland', 14, 106, 1.5, 160 UNION
SELECT 'UK', 18, 4995, 1.6, 8000)
INSERT INTO [fact].Petmetrics
SELECT a.AreaKey, (SELECT PetKey FROM dim.Pet Where PetDescription = 'Cat') AS PetKey,
d.PopulationwithPetsPerct,d.HouseholdswithPets000s,d.Petsperhousehold,d.Petsperregion000s
FROM CTE_CATS d
INNER JOIN dim.Area a ON d.AreaDescr = AreaDescription
Setting up the Production database
For this example the Production database is on the same server but it is likely to be on a different server. Not only that but a different Subscription in Azure
CREATE TABLE [dim].[Pet](
[PetKey] [int] IDENTITY(1,1) NOT NULL,
[PetDescription] varchar NULL
) ON [PRIMARY];
CREATE TABLE [fact].[Petmetrics](
[AreaKey] [int] NOT NULL,
[PetKey] [int] NULL,
[PopulationwithPetsPerct] [int] NOT NULL,
[HouseholdswithPets000s] [int] NOT NULL,
[Petsperhousehold] [numeric](2, 1) NOT NULL,
[Petsperregion000s] [int] NOT NULL
) ON [PRIMARY];
Insert into dim.Area (AreaDescription)
SELECT 'North East' UNION
SELECT 'North West'UNION
SELECT 'Yorks and Humb'UNION
SELECT 'East Midlands' UNION
SELECT 'West Midlands' UNION
SELECT 'East'UNION
SELECT 'London' UNION
SELECT 'South East' UNION
SELECT 'South West' UNION
SELECT 'Wales' UNION
SELECT 'Scotland' UNION
SELECT 'Northern Ireland' UNION
SELECT 'UK' ;
Insert into dim.Pet (PetDescription)
SELECT 'Lion' UNION
SELECT 'Wolf';
WITH CTE_DOGS (AreaDescr, PopulationwithPetsPerct,HouseholdswithPets000s,Petsperhousehold,Petsperregion000s)
AS
(SELECT 'North East', 33 , 425, 1.3, 544 UNION
SELECT 'North West', 27, 825, 1.3, 1053 UNION
SELECT 'Yorks and Humb', 22, 545, 1.4, 773 UNION
SELECT 'East Midlands', 31, 750, 1.5, 1111 UNION
SELECT 'West Midlands', 28, 635, 1.3, 803 UNION
SELECT 'East', 21, 585, 1.4, 810 UNION
SELECT 'London', 92, 312, 1.1, 340 UNION
SELECT 'South East', 25, 950, 1.4, 1320 UNION
SELECT 'South West', 28, 674, 1.4, 940 UNION
SELECT 'Wales', 30, 460, 1.4, 647 UNION
SELECT 'Scotland', 23, 547, 1.5, 820 UNION
SELECT 'Northern Ireland', 40, 302, 1.4, 430 UNION
SELECT 'UK', 26, 6604, 1.4, 9000 )
INSERT INTO [fact].Petmetrics
SELECT a.AreaKey, (SELECT PetKey FROM dim.Pet Where PetDescription = 'Wolf') AS PetKey,
d.PopulationwithPetsPerct,d.HouseholdswithPets000s,d.Petsperhousehold,d.Petsperregion000s
FROM CTE_DOGS d
INNER JOIN dim.Area a ON d.AreaDescr = AreaDescription
WITH CTE_CATS (AreaDescr, PopulationwithPetsPerct,HouseholdswithPets000s,Petsperhousehold,Petsperregion000s)
AS
(SELECT 'North East', 14, 195, 1.5, 286 UNION
SELECT 'North West', 16, 520, 1.6, 795 UNION
SELECT 'Yorks and Humb', 19, 443, 1.6, 680 UNION
SELECT 'East Midlands', 20, 480, 1.8, 854 UNION
SELECT 'West Midlands', 17, 400, 1.7, 662 UNION
SELECT 'East', 20, 512, 1.8, 876 UNION
SELECT 'London', 14, 428, 1.5, 580 UNION
SELECT 'South East', 20, 890, 1.8, 1422 UNION
SELECT 'South West', 21, 514, 1.6, 810 UNION
SELECT 'Wales', 22, 360, 1.7, 596 UNION
SELECT 'Scotland', 15, 381, 1.6, 590 UNION
SELECT 'Northern Ireland', 14, 106, 1.5, 160 UNION
SELECT 'UK', 18, 4995, 1.6, 8000)
INSERT INTO [fact].Petmetrics
SELECT a.AreaKey, (SELECT PetKey FROM dim.Pet Where PetDescription = 'Lion') AS PetKey,
d.PopulationwithPetsPerct,d.HouseholdswithPets000s,d.Petsperhousehold,d.Petsperregion000s
FROM CTE_CATS d
INNER JOIN dim.Area a ON d.AreaDescr = AreaDescription
Setting up Power BI Dataflow in service
As per the recommended approach to Power BI at Enterprise level, a dataflow is going to be added to a dev workspace
Next, Create a data flow
And add all your connection details
Select the tables, in this case its my two dimensions and fact table. then click Transform data.
No transformations are required. All the Keys have been changed from int to text in this dataflow.
Save and Close and Refresh. this dataflow has simply been called Pets
Dev Shared Dataset
Now we are going to create the data set over the top of the dataflow. with the Enterprise Approach in mind we are going to create our shared dataset, containing the model and the DAX. other users could then decide to create reports over this shared dataset.
This is an incredibly simple dataset, and obviously, you will be dealing with much more complex data.
Open power BI desktop.
Get Data
Power BI dataflows
Choose the tables and in this case load the data because no transformations are required
Make sure the model is ok
create some basic DAX
Pets Per Household = SUM('fact Petmetrics'[Petsperhousehold])
Households with Pets (000s) = SUM('fact Petmetrics'[HouseholdswithPets000s])
Pets Per region (000s) = SUM('fact Petmetrics'[Petsperregion000s])
% Population with Pets = AVERAGE('fact Petmetrics'[PopulationwithPetsPerct])
And over this a very basic test report is created
Power Query in Power BI. Set dataflow Parameters
Before we move on. Later we will need to copy this and change the dataflows from Dev to prod. An easy way to do this is to set up parameters
In Power BI go to Transform data
And create another parameter for dataflowID
You can then right click on a Query and find these values specific to working with dataflows. Copy and paste the IDs to Workspace and Dataflow Current Value.
If you go into the dataflow in Service, you can also find these details in the URL.
Once your parameters have the correct information. Go into Each Query Advanced Editor and change the query to using the parameter rather than the hardcoded value
Source{[workspaceId=workspaceID]}
{[dataflowId=dataflowID]}
This means that you simply have to do this once, When you Copy to Production, change the IDs in the parameters to change the data source.
Once completed Close and Apply
Publish the Report
This report is now published to the Dev Workspace
The report has been saved as Dev_Pets and Saved to the Dev Pets App Workspace
Now we are in the position where we are in development in Power BI Service.
In this example, we have checked everything in development and we are ready to move on to create the reporting Pbix file.
It is recommended to create all your reports in a separate pbix file and just use the shared data set for testing visuals
Create the reporting Pbix
Open Power BI
Get Data
Power BI Datasets
Connect to Dev_pets
The model and all the DAX is pre prepared. recreate your reports. Imagine in a real life scenario, this would be a much more polished version of your test reports
There is now a Live connection between the power BI Dataset and the reporting Dataset.
Save and Publish the report
And again, save to the Dev workspace
There is a dataflow
A Dataset and a test report over the dataset (dev_Pets)
and a Report (Pet Statistics in the UK) live connected to dev_Pets dataset
We are ready to move to Production
Production Workspace
We now create a Production Workspace
Move Dataflows to Prod
Back in dev workspace, go to the dataflow and click on …
Choose Export Json
It downloads to the Downloads folder.
Open the JSON in Notepad ++
We are looking for each query to update:
Source = Sql.Database
and then the database \”Dev_PET_DB\”)
For this example, only the database needs to change.
You may also wish to change the name of the dataflow in the JSON file
This JSON File can then be saved.
Go back to the Production Workspace
+ New Dataflow
Open the JSON file that has just been amended
This will be imported into power BI
And you will probably need to establish your Production Credentials
And I can immediately see that we are in Production because our cats and dogs have got fiercer.
This will need to happen every time you move to Prod. Export the JSON and update the information about the data within the JSON file.
Power BI Desktop
We have the following pbix files
And a Production Folder has been created. Copy both of these reports and add them into Production
Dev has been renamed to Prod. these can be opened and Published to Prod
Open up Prod_Pets in Power BI desktop
Go to transform data
Now you can simple change the parameters to prod to change the data flow source. You have already set each query to use the parameter in Dev
Where does the production IDs come from?
go back to the power BI Service. Into the Production dataflow and get the URL
Once the dataflow source has been changed, Close and Apply
This would be an easier process if you were connected to your SQL Database. You could simply change the data source. Dataflows make this task much harder to do.
Then Publish to Prod
Open up Prod_Pets from the production Folder in Power BI desktop
This has a live connection to the dataset that was just published. We need to change it from dev to Prod
And change to Prod_Pets
You can then tell your report has changed, in this case my animals have changed.
If your data is the same in production and development it becomes a lot harder to establish that you have done the right thing
Again, Publish your reports
Test your Production Reports
Now its time to test your Reports to make sure they are working ok.
What about Dashboards?
So far, we haven’t covered dashboards in this situation. This is dealt with automatically within the pipeline, but without the pipeline, how difficult is this to deal with?
Create a Dashboard in Dev
back in development workspace, lets pin a couple of visuals to a dashboard
we can do this by using get Quick Insights over the dev_Pets dataset. there is only one insight because the data set is so small but we can pin this to a dashboard
For the target dashboard. create an empty dashboard in Production
Now we have more content in dev, but it looks like without Pipelines, there is no way of moving the dashboard easily.
After reading some of these documents, if you are happy using Powershell or REST APIS these may be ways forward. Otherwise you will have to recreate your dashboards from scratch in Production. Its about weighing up which will be faster for you.
Creating Apps
We have a dev Workspace and a Prod workspace. In this situation I may offer an app in development to the testers. The app in Production is for all the Report users.
With this in mind go back to the Dev workspace
And do the same with the production App from the production workspace. the word Production is removed from the App.
And of course for each of these apps you can set up Navigation and Permissions.
Conclusion
There are multiple issues here outside of Power BI Premium.
Dataflows have already proved difficult to work with outside of the Premium environment and here they cause issues when attaching the production shared data set to the Production dataflows. Imagine having multiple reports and many queries to deal with. there are way to many error points in this process.
There is also an issue with the dashboards at present.
It would seem that this set up may be too much to deal with outside of the Premium environment using Pipelines.
Its possibly one to avoid if you
Have many reports
Have many dashboards containing alerts etc.
Have large data models with many queries in Power Query Editor
Use Dataflows
Aren’t fully familiar with using REST APIS or Powershell for Power BI if you have Dashboards
In this case, the only options are:
Move to Power BI Premium and start using Pipelines (Proviso on Pipelines working with Dataflows)
Simply have one workspace as dev and use your App as Production
Think about Power BI Premium Per User license and move to Pipelines
Understand that if you go this route, the time from dev to Prod may be considerable and there must be extra testing in case there has been anything missed along the way.
It is very easy for Power BI Developers to create and then publish reports to the service without much thought.
It will be different from company to company, but it would be great to remind developers each time they publish that there are certain standards that need to be maintained for each published report
With the December 2020 Update there is now a way for the Power BI Admin to create a message for your report Developers on Publish.
The power BI Admin (or global Administrator) can go into Power BI Admin Portal
As the Admin, lets add a message for our users to make sure they understand the importance of the security on the App workspace.
Should they be using Security groups rather than email addresses?
There are many considerations that you can address here (to 5,000 characters)
This new setting may take about 15 minutes to work and become part of the publish process.
Once set up, every time you publish you will see the disclaimer
This gives your developers a final reminder of all the checks they need to do before publishing.
This is a great new addition to the Admin tenant settings.
Power BI Loves a Star Schema and It loves single direction joins, one to many from your dimension (Description) tables to your central fact (Business metrics) table
The reason for the single direction filter join? You want to be able to filter your measure by descriptors. Sales by Product category. Quantity Sold by Business Unit.
There isnt a need to filter a descriptor by a measure. it cant happen.
This is nice simple logic which works really well. However, there are some use cases where this may not apply. Lets look at our Activities model to get more of an idea of this in action.
Activities Model
The Date table is used in lots of other models and has dates from 1990 to 2035 in it.
This model only has 10 years of data and its important that the latest date for all the DAX and Filters is not the current date but the last date in the data
This model is at year level and the last year in the data set is Currently 2019 (We are now in 2021)
the first thing to do is to test that the flags are working
Year from the date table
Flags from the flag table
And this works fine. There are only flags to 2003 to 2019 so all the years not attached to these are omitted and its all fine.
Then Activities measure from the fact table is added and it all seems to go wrong (Keys have been added to show the issue)
Note that Activities are 0
The Key (dateKey from dim to fact, FlagKey dim to fact) are essentially cross joining. There should only be one year.
If you Filter the Table so Activities are greater than 0 everything is resolved. The Fact is being filtered.
What is happening?
When the measure comes back as 0 or Null, we are not filtering the fact table
So we want to filter year by the flag but there is only a single direction filter to the factor table. Without the filter on the fact table, its almost like there is now a block in the middle, not allowing other filters to work.
You only see this because:
a. You want to see metrics that are null or 0
b. If the flag was in the date table rather than a separate dimension then there wouldn’t be an issue. Because its in another dimension it cant filter the year.
For this specific issue, the joins between date and the fact and the flag dimension and the fact has been changed from Single Direction to cross join.
Now the flag table can filter the year if we aren’t filtering the measure.
Why are cross joins not recommended in power BI?
There is always a performance issue when you do the bi directional join so you should only do this if you have to.
Bi Directional Filters are one of the top Power BI performance Killers because Power BI has to work much harder with that join
Other Ways to Resolve the issue
Resolve in SQL
The Flags are specific to the report date NOT the current date. But, if the Date dimension was created in SQL Pre Power BI, these flags could have been added in the Date table. Then simply imported into Power BI within the Date dimension
Resolve in Power Query Editor in Power BI
With the Date Dimension and the flag dimension still intact in Power BI.
In Power Query Editor, Merge Flags into date,
Add in the Flag for the last 10 years into the date table.
Then Filter the date table so there is only 10 years worth of dates.
This would ensure you didn’t need to cross filter join so long as the criteria is that you want to see 10 years of data
Its going well, I have however been left with an issue. every time I move into Production details for the Linked Services have to be re added. Lets have a look at the SQL Server and the Data Lake gen 2 account.
Development
Notice that the information has been entered manually including the Storage account Key.
Again, in this instance the information has been entered manually. SQL Server Authentication is being used because we have a user in the SQL DB with all the privileges that Data Factory Needs.
DevOps Data Factory release Pipeline
Go into Edit of the Release Pipeline
Within Prod Stage we have an Agent Process
We are looking for the Section Override Template Parameters
Note that currently Account Key and SQL Database Connection String are null.
Provisioning Azure Key vault to hold the Secrets
Managed Identity for Data Factory
Copy your Azure Data Factory Name from Data Factory in Azure
You need to have a Key vault set up in Development
GET and LIST allows Data Factory to get information from the Key Vault for secrets
Paste the data factory name into Select Principal
Key Vault, create a Secret for the Azure Data Lake Storage
For the Key Vault Secret. I gave it the Secret value by copying across the Access Key from the Azure Storage Account Keys Section
The Content type was simply set as the name of the Storage Account for this excercise
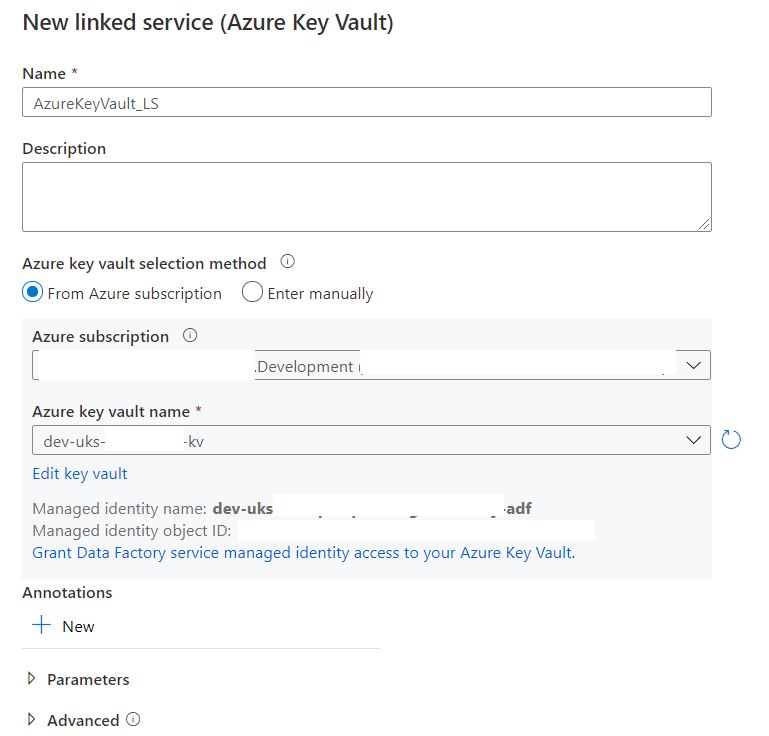
In Data Factory Create a Linked Service to the Key Vault
Test and ensure it successfully connects
Use the New Key Vault to reset the data Lake Linked Service
How does this Data Lake Linked Service change the DevOps Release Pipeline?
Its time to release our new Data factory settings into Production. Make sure you have Published Data Factory into Devops Git.
Production Key vault Updates
We need to update Production in the same way as Development
In Production Key vault add the Production data factory name to Access Policies (as an Application) With Get and List on the Secret
Ensure that there is a Secret for the Production Data Lake Key AzureDataLakeStorageGen2_LS_accountKey
Check your Key vault connection works in Production before the next step
Azure DevOps Repos
In Azure Devops go to your Data Factory Repos
Notice that your Linked Service information for the Data Lake now mentions the Key Vault Secret. its not hardcoded anymore which is exactly what we want
Azure DevOps Release Pipeline
Go to Edit in the Data Factory release pipeline
When the job in Prod is clicked on, you can go to the Override Parameters Section. And notice there is now an error
AzureKeyVault1_properties_typeProperties_baseUrl is the missing Parameter. Basically at this point you need to delete the code in the Override template Parameters box and then click the button to regenerate the new parameters
Override with production information (I saved the code so I could re copy the bits I need.
Once done, notice that the -AzureDataLakeStorageGen2_LS_accountKey “” parameter is now gone because its being handled by the key vault.
Lets Save and Create a Release
New failures in the Release
2021-02-08T13:45:13.7321486Z ##[error]ResourceNotFound: The Resource ‘Microsoft.DataFactory/factories/prod-uks-Project-adf’ under resource group ‘prd-uks-Project-rg’ was not found. For more details please go to https://aka.ms/ARMResourceNotFoundFix
Make sure that your override parameters are ok. I updated:
Data Factory name from Data Factory
Primary endpoint data Lake Storage from Properties
Vault URI from Key vault Properties
Repeat the Process for SQL Database
With everything in place we need to introduce a connection string into Key Vault
I have a user set up in my SQL database. the user has GRANT SELECT, INSERT, UPDATE, DELETE, EXEC, ALTER on all Schemas
I want to include the user name and password in the Connection string and use SQL authentication
Secret Name
AzureSQLDatabase-project-ConnectionString
Secret
Server=tcp:dev-uks-project-sql.database.windows.net,1433; Database= dev-uks-project-sqldb; User Id= projectDBowner;Password= Password1;
the connection string has been set as above. For more information on connection strings see SQL Server connection Strings
Go back to Data factory and set up the new secret for SQL Server
This is successful
Data Factory and DevOps
back in Data Factory Publish the new linked Service Code
go into Dev Repos and check in Linked Service code you are happy with the new Key vault information
Go to Prod Key vault and make sure you are the Secret is set with the Connection String for SQL DB
Test the Key vault secret works in Prod
Back in DevOps Go to Release pipelines and Edit for the adf Release CD pipeline (Release Pipelines are Continuous Delivery. Build pipelines are CI for Continuous Integration)
Edit Prod Stage (I only have Prod) Arm Template Deployment Task, Copy Overwrite Template Parameters code into a file for later
Delete the code and click the … to get the latest parameter information
Re add your production parameters, most can be taken from the code you just copied.
Create a new Release
go to Linked Services in Data Factory and check they are still Production. They still use Key vault and they still work
Now this is all in place, Development Data factory can be published up to production. there is no need to reset Linked Services and all your information about Keys and passwords are hidden in the Key Vault